


Can human capital growth stop the stagnation of living standards?
More favourable demographics and employess working longer hours lead to higher GDP per capita growth in USA.

Spoiler: Productivity growth is declining almost everywhere. This is not surprising. As we have become richer, our choices of consumption, number of children, and other choices have led to decreasing productivity growth and also increasingly older populations. Ageing populations means that the share of population in working ages is shrinking. We are facing a future with lower GDP per capita growth.
The problems vary across countries. USA has a more favourable demographic composition than European countries and Japan. A higher share of people in the working age working more hours than in Japan and Europe, lead to higher US future growth of GDP per capita.
In this post I will decompose and compare GDP per capita growth in the USA to France, Germany, Japan and the UK. Since 1970, growth of GDP per capita, measured as ten-year average annual growth rates, have declined.
GDP capita growth 1960-2019.
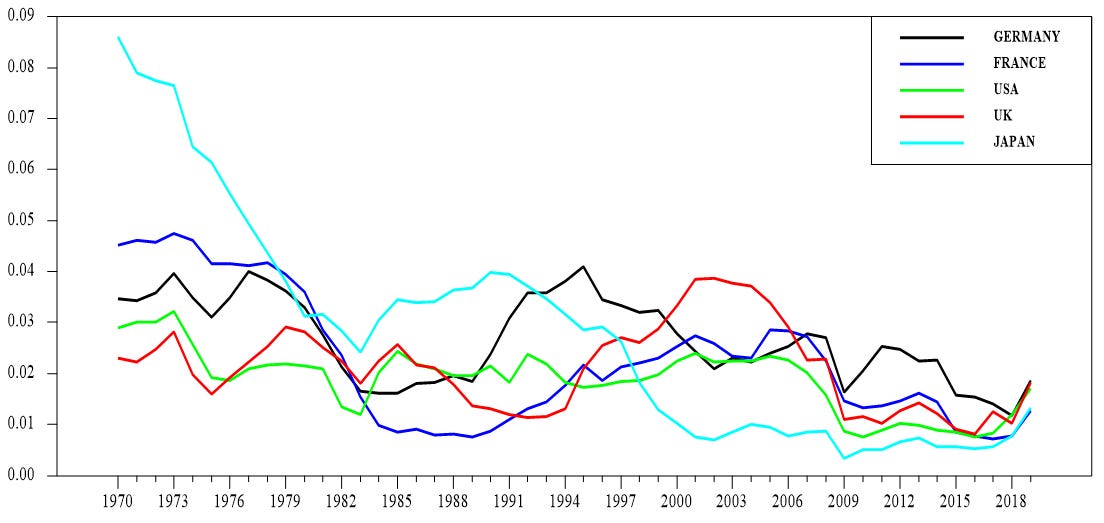
Source: Ameco Database, European Commission. Note. Ten year average annual growth rates computed as .1*ln(yt/yt-10).
In what follows I will decompose by growth accounting. I hope it doesn’t look like I’m suggesting that there are any casual relationships between the components. This is growth accounting. Accounting explains nothing, it merely slices up the changes of GDP per capita growth into its components. In this post I only use data up to 2019. The reason is that I use data on returns from education from the Penn World Table. This data ends in 2019.
I have covered Sweden in previous posts here

and in the posts mentioned therein in case you’re interested. The choice of countries in this post is somewhat ad-hoc. I wanted to include large countries in America, Asia, and Europe. I excluded China because I don’t trust its statistics. Some years ago the idiot Mao’s starvation of his own people resulting from “The Great Leap Forward”, or as it is better known, “The Great Famine”, was clearly visible in UN population statistics. In his book, "Factfulness”, Hans Rosling had a graph showing that the Chinese famine caused the world’s population to decrease at least for one of the years of the famine. But since China has flooded the UN offices with its people, the UN data now indicates that the Chinese populaton instead grew between 1959 and 1961. But the guys at Groningen who runt the Penn World Table, still tell the truth. Sorry for the derailing.
Growth accounting
Real GDP per capita, is defined as.
where Y denotes GDP, and N population. The expression for GDP per capita has been derived from a Cobb-Douglas production function
where K is the physical capital stock, H the human capital stock, A is productivity and alfa is the elasticity of output wrt to capital. The human capital stock is measured as the product of educational attainment and number of hours worked, H = education*hours worked. Educational attainment is measured as returns on education. The measure includes both years of schooling and returns to education. The measure of education is constructed by the people behind the Penn World Table.
Hours worked per capita can be further decomposed in terms measuring average hours worked, the employment rate and the working age population rate. Therefore, the human capital stock per capita, education * hours worked per capita is.
N15-64 denotes the working age population which is assumed to be between 15 and 64 years of age in all countries.
Growth of GDP per capita, is therefore the sum of the growth of capital per output, productivity growth plus the the components of human capital per capita. The capital per output ratio is weighed by the inverse of one minus the output elasticity of capital to adjust for the endogeneity of capital and output. The productivity term, A, is weighed in the same way to account for the endogeneity between capital and technology. The formulation has been used by Hall, Jones, and Vollrath. The elasticity is assumed to be 0.3. There are lots of articles where this elasticity is estimated. I can’t rembember which one I used for this post.
Human capital growth has not been large enough to compensate for the declining productivity growth.
Productivity growth is what is left to explain of GDP per capita growth after we have taken into account things that we can measure. It can be implementation of new technology, better use of existing technology, more flexible organisations, better management and whatever. Since growth theory predicts that the capital-output ratio is constant, contributions from capital-output to GDP per capita should be small. Thus, growth of human capital per capita should account for the largest contribution to GDP per capita growth when productivity growth is declining.
And productivity growth is declining. This is a consequence of our increasing living standards as I wrote in this post.

Declining growth rates of GDP per hours worked are a consequence of how patterns of consumption change when incomes increase. As incomes increase, demand shifts from goods to services. The relatively stronger demand for services leads to a reallocation of capital and labour towards these industries from goods-producing industries.
The change in industrial structure reduces overall GDP per capita growth since Services industries’ productivity growth is lower than Manufacturing industries’ productivity growth. Thus, the contribution of the less productive services industries, to GDP per capita growth, increase at the expense of the more productive manufacturing industries.
And of course not only in Sweden which the above post was about, but also in the five countries I cover in this post. Productivity growth rates were lower during the last years of the sample than previously.
Productivity growth 1960-2019.
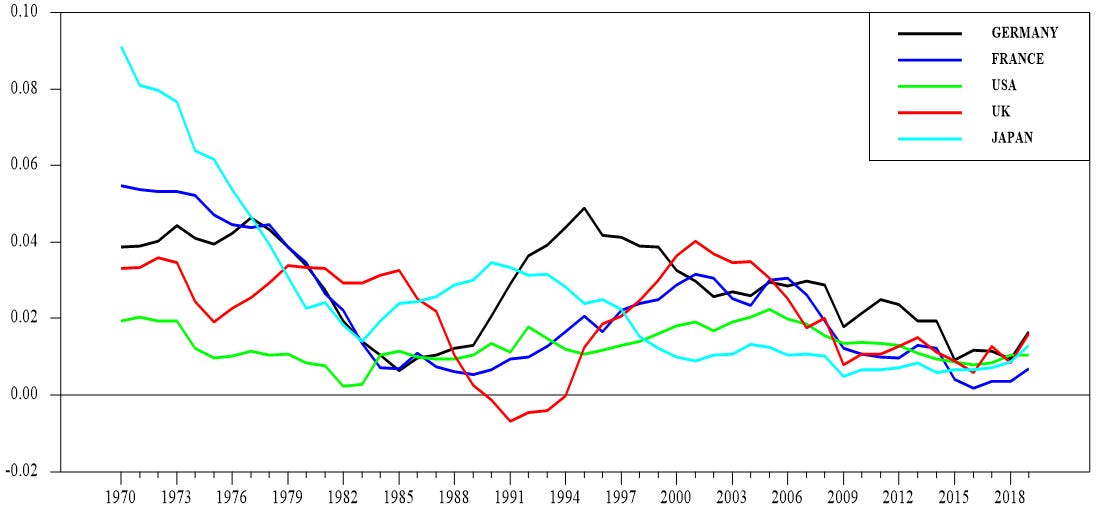
Source: Ameco Database, European Commission. Penn World Table, Groningen Growth and Development Centre. Note. Ten year average annual growth rates computed as .1*ln(yt/yt-10).
In case you want a more detailed account of how our increasing prosperity has led to declining productivity growth, you should read “Fully Grown” by Vollrath.
As mentioned above, growth theory predicts that contributions from changes in the capital-output ratio, are temporary. Over a longer period of time, even though one shouldn’t try to translate theoretical predictions of “long-run” to empirical developments, one should not expect that variations in capital per output matter much. And data supports my belief. The capital-output ratio increases during periods of time with large investments. As time passes, the investments begin to generate incomes, the ratio falls back.
Capital-output growth 1960-2019.
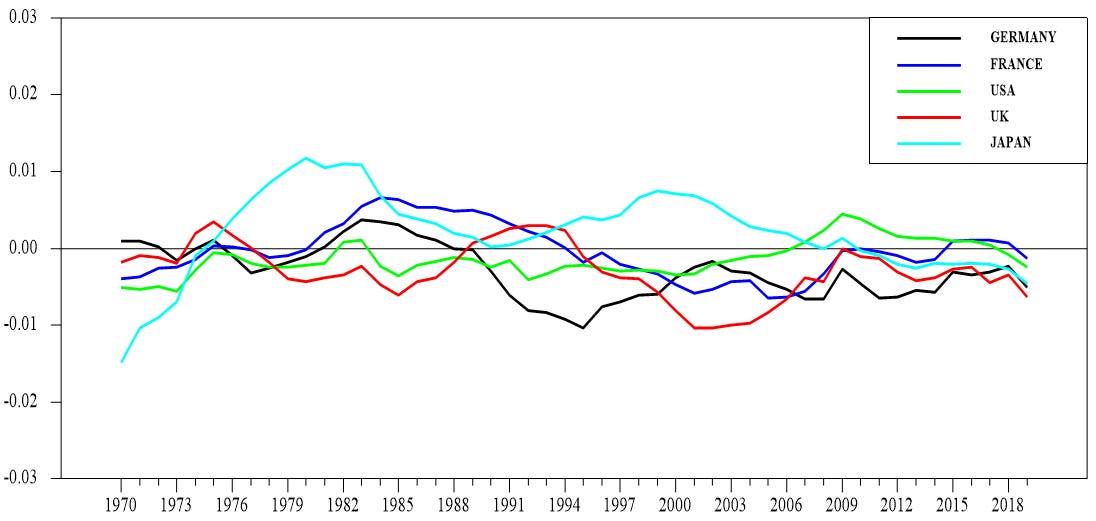
Source: Ameco Database, European Commission. Penn World Table, Groningen Growth and Development Centre. Note. Ten year average annual growth rates computed as .1*ln(yt/yt-10).
This leaves a lot to human capital growth. Human capital consists of several components. Some of these tend to vary positively with increasing prosperity with other negatively. This might explain the large variations across countries in the growth rates of human capital per capita.
Human capital per capita growth 1960-2019.

Source: Ameco Database, European Commission. Penn World Table, Groningen Growth and Development Centre. Note. Ten year average annual growth rates computed as .1*ln(yt/yt-10).
To better understand the variations in the human capital stocks per capita, a decomposition is made below. Human capital per capita is the sum of education and hours worked per capita. Hours worked per capita, is in turn the sum of the last three components, hours worked per employee, the employment rate, and the working age population rate.
The large contributions from education is not surprising. Enabling more people to go to schools and increasing the years of education shows up as large positivt numbers in many countries, even at constant returns to education. Only in the USA do hours worked per capita grow between 1960 and 2019. The income effect dominates the substitution effect in all countries. The negativt growth rate shows that people have chosen to work less as their incomes grow. The effect in USA is however much smaller indicating that relatively more Americans choose to work more as their incomes grow.
The employment rate has increased in all countries, albeit very little in France. The last row shows that USA is the only country with a declining dependency ratio. The workinga age population ratio is increasing which means that increasingly more people are supporting less people in the ages 0-14, and 65+. It is the other way around in the European countries but especially so in Japan.
Growth accounting. Ten-year annual average growth rates of GDP per capita 1960-2019. Percent
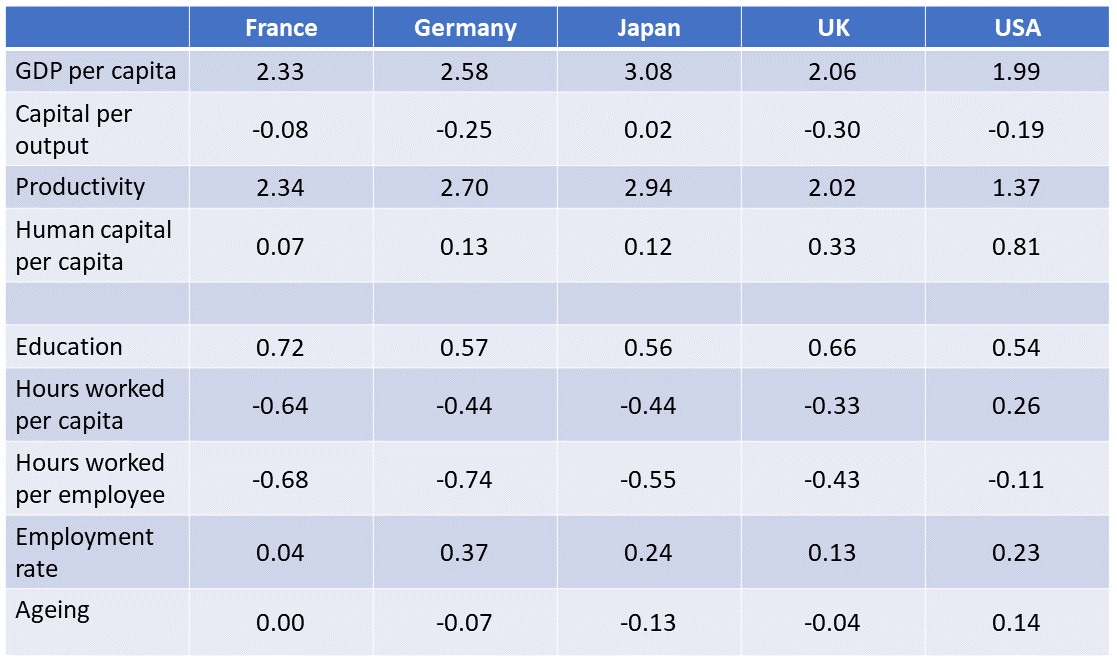
Source: Ameco Database, European Commission. Penn World Table, Groningen Growth and Development Centre. Note. Ten year average annual growth rates computed as .1*ln(yt/yt-10).
Tables are fine but I prefer graphs. Graphs show developments for the whole period of time and not only between two or more points of time. I therefore graph the components of the human capital stock below. First the two main components, education and hours worked per capita. Then, the components of hours worked per capita; hours worked per employee, the employment rate, and finally the working age population rate.
More people in the working ages working longer hours lead to higher GDP per capita growth in the USA.
As mentioned previously, the education variable is essentially made up of the number of people, their years of schooling, and returns to education. This should increase over time. The returns to education are stronges in the UK, and the USA. Growth has declined more in Germany which has the gap relative to Japan to narrow. For the whole time period, French growth of returns to education is strongest, possibly because it started on a lower level.
Returns on education 1960-2019.
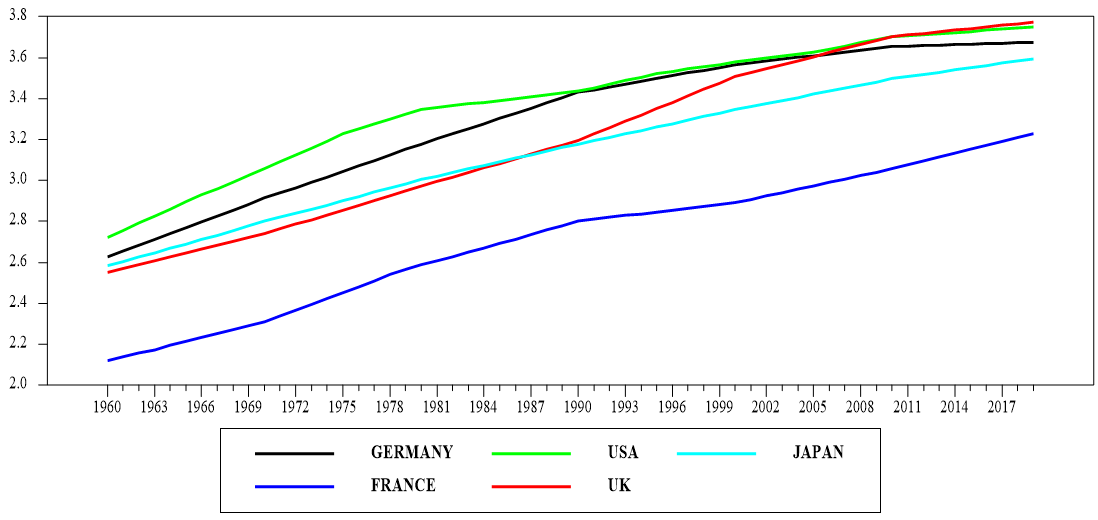
Source: Penn World Table, Groningen Growth and Development Centre.
Graphing hours worked per capita confirms the numbers in the table. Only in USA are hours worked per capita increasing except for the years between 2000 and 2009. After having levelled out at the beginning of the Global Financial Crisis, hours worked per capita appear to drop again in Japan. Developments in Germany and the UK ar e similar. After falling initially, they have levelled out or are even slightly increasing during the last decade. The French have got it. Work is bad. Period.
Hours worked per capita 1960-2019.

Source: Ameco Database, European Commission.
Hours worked per employee has declined in all countries, showing that the income effect has dominated the substition effect almost everywhere for the whole period of time. American workers are behaving differently. The income effect is stronger until the beginning of the 1980s when the substitution effect dominates. The two effects cancel out each other since the Millennium.
Hours worked per employee 1960-2019.

Source: Ameco Database, European Commission.
Employment rates have increased everywhere, although very little in France. The largest contribution to GDP per capita growh occur in Japan, Germany and the USA.
Employment rates 1960-2019.
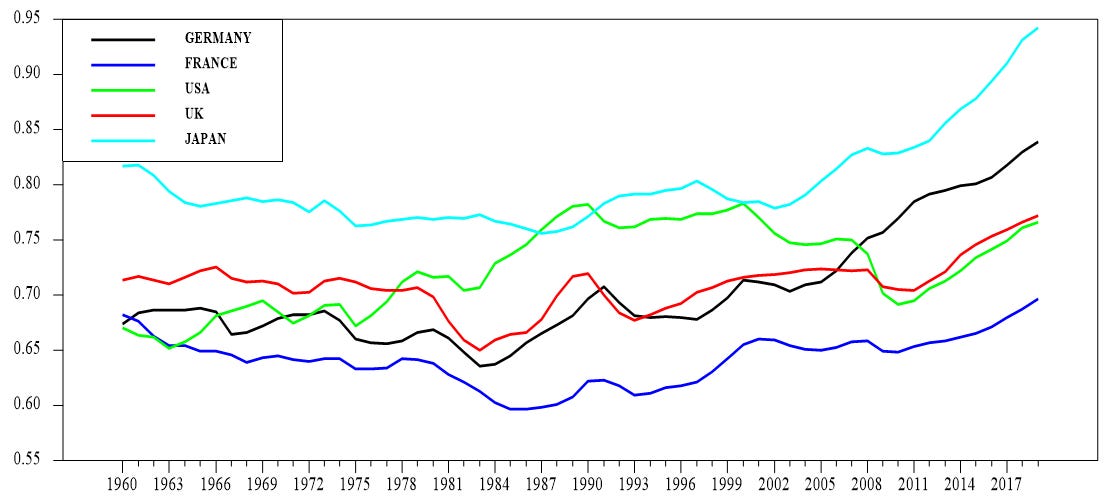
Source: Ameco Database, European Commission.
Japan has a problem. So do many countries but the Japanese development is more dramatic than in most countries. From a working age population share of almost 70% around 1990 to below 59% in 2019. The working age population shares are declining, the dependency ratios increasing, in all countries below, but less so in Germany. USA has still got the highest working age population. And USA is the only country where this component has a positive contribution to GDP per capita growth.
Working age population rates 1960-2019.
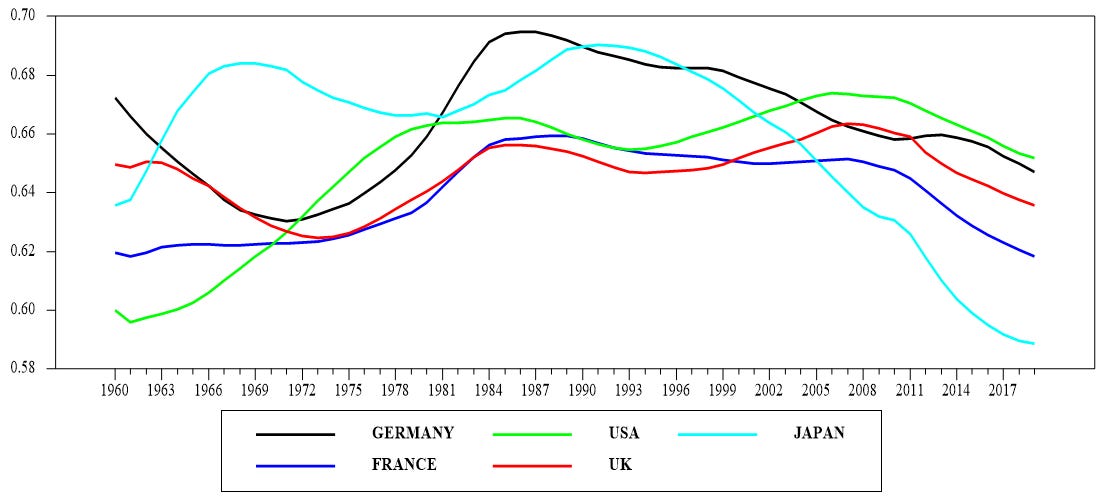
Source: Ameco Database, European Commission.
The problems in Japan will not go away tomorrow. The fertility rate was only 1.3 in 2021, compared to 1.53, 1.56, 1.66, and 1.79 in Germany, UK, USA, and France respectively. France needs a high fertility rate to counteract its high dependency ratio. A third of its population needs to support two thirds, 63% who are in the ages 0-14, and 64+. Dependency ratios in Germany, UK, and USA are about 10 percentage points lower. As mentioned, Japan have problems. The dependency ratio is higher than 70%.

Can productivity growth be restored?
Maybe. Techno-optimists like to emphasize the importance of new advances in vaccine development, A.I, bio-tech, energy technologies for producing and storing, and more. I have myself blogged positively about the future here

and here

But none of the articles I’ve read, discuss the implications of the changing industry structures on productivity growth. Since we consume more and more of services, we to offset the declining weights of manufacturing with more productive services industries. In my earlier post here,
I show that some Market Services display high growth. That refers especially to Information and Telecommunications services. Hopefully, technological innovation such as AI, may improve growth in other services industries too. There are however more constraints to productivity in Services industries.
One large constraint is the far from complete Single Market for Services. Many Services industries are still heavily regulated in the EU. The regulation of services industries may be one explanation why very few new tech firms are born and developed in the EU. There are fears that the freshly announced EU regulations of AI will hamper AI development in the EU to the benefit of US.
The tables above indicate that returns on eduction is declining. The reasons for that probably vary across countries. A related source of productivity growth which I haven’t explicitly mentioned above, is R&D. A lot of that takes part in universities and publicly financed research institutes. As ideas, according to some people, are getting harder to find, resources must be spent more wisely.
This is probably not only a Swedish problem even thought the problem in Sweden may be bigger than in many other countries. I wrote an angry post about that here

in which I furiously rambled about how R&D resources had been diluted not only between universities and “högskolor”, but also within them.
To answer the question and to end this too long blog post, yes growth can be restored but not easily. More people are needed. The returns to education need to be increased, the Services industries need to be de-regulated, new technology unregulated, and R&D expenditures focused.
That is easier said than done.