


We need better educated people to work longer

Spoiler: In my previous post, I showed that we need more people to work longer. In this post I will look at the composition of human capital. I calculate a human capital stock as the product of the number of hours worked, the number of employees, and the experience and the education levels of the employees.
The decomposition of the contribution of human capital per capita growth to GDP per capita growth shows that growth of education and experience, i.e., skills have declined over time. The decomposition of human capital does not take the quality of education into account. Over time, resources to higher education have been diluted both extensively and intensively. Several low-quality post-high school institutions have been established at the same time as many vocational educations have received academic statuses. The additions of that to the knowledge stock can be debated.
A Swedish human capital stock
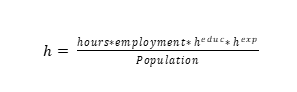
In my previous post, I showed that an ageing labour force is a drag on Swedish GDP per capita growth. In this post, I will elaborate on the contribution of labour to GDP per capita growth. The contribution of labour goes beyond the number of hours worked by the employees. The educational attainment and the skills learned by experience matter too. The human capital endowed in an employee consists of the number of hours she works, her education and experience. For a country, the human capital stock is the sum of the human capital of its employees and can be calculated as hours*employment*education*experience. Hours and employment are expressed in millions. The calculations of education and experience follows Vollrath (2020).
The human capital, from education, of an employee is assumed to increase by 10% of an additional year of schooling. For employee j: ln educationj = 0.1*sj where sj is the assumed value for years of schooling for the educational level where the individuals belong. There are eight levels of education in the Swedish population statistics of educational attainment. I merged the two educational levels for people with pre-high school, into one, two educational levels for people with high school education, and two levels of university educational levels of different lengths. That yields five educational levels: no information, pre-high school, high school, university, and graduate school.
Without any information about the distributions within these categories, I assigned the values of schooling, sj, for each educational level to 2, 4.5, 11, 14.5, and 17 respectively. These values correspond to assumed midpoint values for years of schooling for the education levels. This is probably wrong, especially for the people for which there is no information regarding their education. As pointed out in Vollrath (2020), the construction of both the educational and experience stocks are made assuming that the educational and experience characteristics of the employees are the same as for the whole population.
Anyway, for all educational levels, the human capital component of education was calculated as:

Where Njeduc are the six educational levels.
The human capital, from experience, takes ageing into account: ln experience = 0.05 * xi – 0.0007 * xj2. For each year worked, the employee’s human capital (skills) is assumed to increase by 5% but also decrease due to wear and tear. This depreciation rate of human capital increases by age as indicated by the quadratic term. xj is the midpoint value of the different groups of age in the ten groups for the population aged 15-64 years provided in the population statistics from Statistics Sweden.

Where Njexp are the ten age groups. The human capital stock per capita is then calculated as:
The developments of the Swedish human capital stock per capita over time reflects mainly the effects of hours worked and employment. Variations in these during the Swedish Financial crisis in the beginning of the 1990s, the Global Financial Crisis in 2008-2009, and the Covid-19 crisis are clearly visible. Later developments also reflect an ageing workforce and an increasing
share of an increasing number of people with no information of educational attainment. It also reflects the decreasing rate of enrolment in tertiary education since the turn of the Millennium, c.f. Figure 1.

Source: Statistics Sweden. Hours worked, employment, population age structure,and education levels Statistics Sweden.
Growth accounting
The growth accounting exercise in this post is done in another way, compared to previous posts, to show the effects of human capital and its components. I do it the same way as Vollrath (2020). GDP per capita, is calculated is composed of physical capital per capita, k, human capital per capita, h, and productivity, A.
Productivity growth is calculated as the residual of GDP growth minus its inputs. GDP per capita growth is decomposed into growth of capital per capita growth, productivity growth and human capital per capita growth.
Vollrath (2020) argues that he justifies that physical capital needs to be adjusted for its dependency on GDP. Adjusting physical capital for its dependency of GDP, yields a growth accounting equation with a term showing the contribution of the growth of the capital-output ratio, growth of human capital per capita, and productivity growth.

The contribution of human capital per capita growth to GDP per capita growth is further decomposed into its components, hours, employment, education, and experience. Unfortunately, data on education levels for the population is only available from 1985 which precludes comparison to my previous calculation before that year.
Most of the growth of human capital per capita growth before the Millennium was due to growth of the education component. The contribution after the Millennium is much lower than before the Millennium. This occurs because changes in the composition of the total educational stock are more favourable before the Millennium. The share of the lowest level of education even increases while the two highest levels grow less than earlier. The negative effect of the ageing working age population which I showed in my previous post is confirmed below, c.f. Table 1.
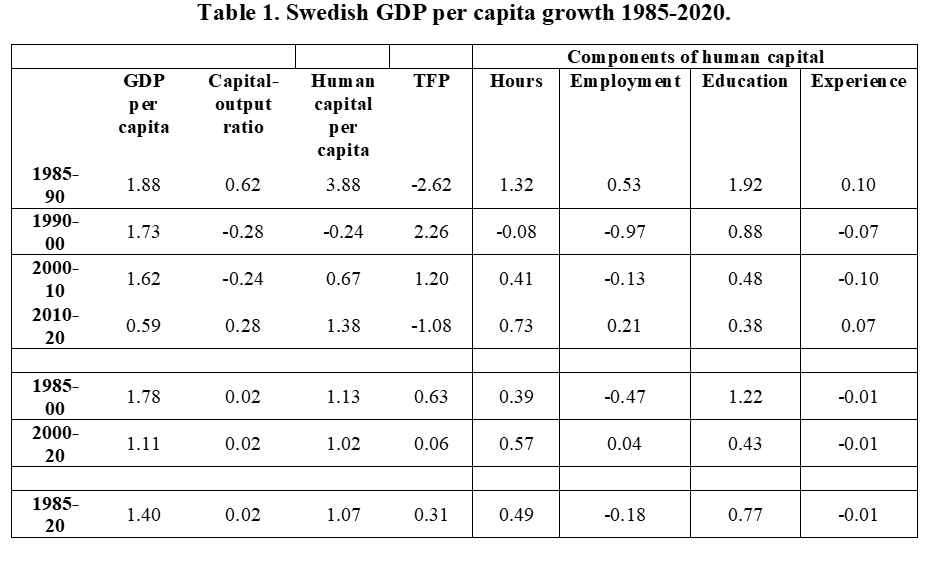
Source: GDP, capital stock, hours worked, employment, and population.Ameco Database. European Commission. Population age structure,and education levels, Statistics Sweden Note: Average annualised growth rates for all periods. The values in the last four columns sum tothe values in the column “Human capital per capita”:
The large contribution from the educational component in the beginning of is probably due to the large decrease of the share of people for which information about their education is missing. At the same time, the shares of people with 10-12 years of education and tertiary education increased. However, as discussed above, the assumptions behind my construction of the educational stock are strong. The large contribution may therefore be overestimated.
The contribution of the capital-output ratio over time is modest as neoclassical growth theory predict. This is supported by data showing a relative stable capital-output ratio over time. The contributions from productivity growth decline over time as I have pointed out before.
The ageing problem revisited
Table 1 shows that the contribution of the experience component, to GDP per capita growth, declines as the labour force becomes older. At some age the effects of wear and tear kick in, and we also become less able to adapt to new technology and production process. Therefore, the return of experience begins to decline. This effect becomes stronger the older the labour force is. Since 1985, the share of employees aged 50-64 years, in all employees, has grown from 25% to 30%, c.f. Figure 2.
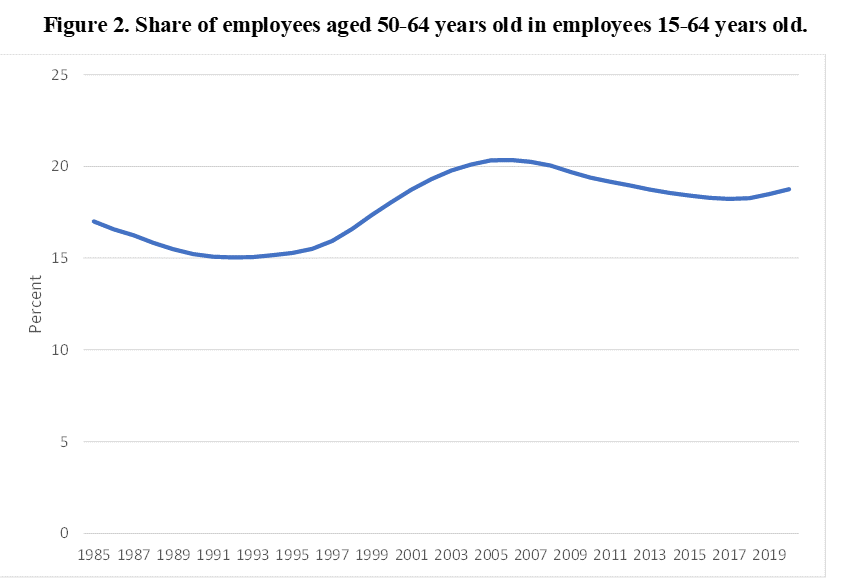
Source: Statistics Sweden.
As pointed out in my previous post, declining fertility rates are causing this development.
Problems ahead
The lower growth of human capital after the Millennium is partly due to the expansion of the higher education system that occurred before the Millennium. But there are also other factors at play which negatively affect human capital growth. The return of education is lower in Sweden than in many other countries. The wages are more compressed, and taxes are higher. Swedish students are older than students in most OECD countries. The average age of a new student was almost years compared to the OECD average of 22 years. This means that the average Swedish student enters the labour force later than in most other OECD countries. And, as Matt Clancy shows, the age of scientists is negatively associated with their productivity, the relatively higher age of Swedish scientists adds negatively to the human capital stock.
Swedish R&D expenditures have always been higher than the OECD average, but the output has often been disappointing. The latest report from the Swedish Research Council shows that, overall, Sweden, despite high R&D expenditures, is not among the foremost in terms of scientific citations. This is probably to a large extent explained by the composition of Swedish higher education institutions. According to the report,
“In the Swedish higher education sector, it is primarily the broad-based established universities and the specialised universities that are responsible for the scientific production.”
The last two decades or so have witnessed an inflation of new universities and regional higher institutions requiring high school exams. These are named “högskolor” in Swedish. The inflation in universities, högskolor, teachers and professors at these institutions have taken place at the expense of the established universities. Research is best performed at institutions which have a critical mass. The new universities have mostly been established due to misinformed ideas about regional growth. In short, Sweden have too many universities and professors as this report from the Swedish Research Council shows.
I don’t know the English name and apparently the “högskolor” don’t know it themselves since they present themselves as universities as this Borås Högskola does. But Borås Högskola and other are not universities. Most of them are not able to offer more than under-graduate courses and there is little or no meaningful research conducted in them. Here are for example Borås Högskola’s research areas…
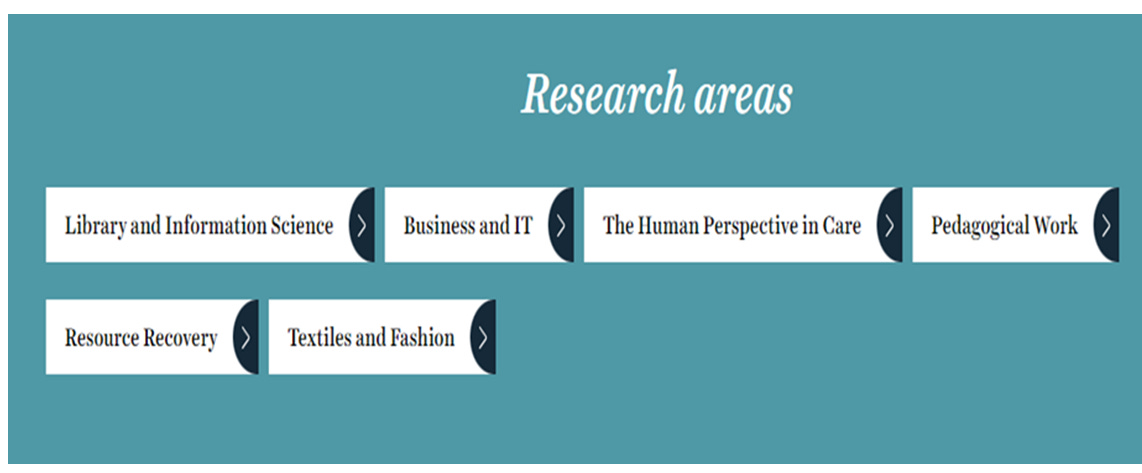
Source: Web site of Borås Högskola. https://www.hb.se/en/research/
It gets worse. Skövde Högskola with an English website announcing themselves as a university, offers preparatory courses for students aiming at university (högskole) exams in fields of engineering. The web site is not clear to what extent the preparatory courses in math, chemistry and so on differ from the courses in high school. And I’m not sure I want to know….
The dilution of resources has also taken place within universities. The lengths of several education programmes with more vocational profiles have been increased. For example, the education of midwifes have increased with a year from three to three and a half years. On top of that, midwifes can now be write doctoral theses and become MDs. And in other news from it is now also possible to get a university exam as a hippologist….
I could go on for pages like this but that would raise my blood pressure to a critically high level. The conclusion is anyway that we have problems.