


How Sweden chose lower growth

Spoiler: Swedish GDP per capita growth is declining. The decline is mainly due to decreasing growth of GDP per hours worked. While average hours worked, the employment rate and the labour force participation rate worked in the other direction, the contributions from these factors are small. The working-age population rate continue to decrease.
The declining growth rates of GDP per hours worked are a consequence of how patterns of consumption change when incomes increase. As incomes increase, demand shifts from goods to services. The relatively stronger demand for services leads to a reallocation of capital and labour towards these industries from goods-producing industries.
The shift leads to a change in the industrial structure which reduces overall GDP per capita growth through two channels. Firstly, increasing shares of services in overall consumption, increases the weight of services industries relative to manufacturing industries. Secondly, services industries’ productivity growth is lower than manufacturing industries’ productivity growth. Thus, the contribution of the less productive services industries, to GDP per capita growth, increase at the expense of the more productive manufacturing industries.
This may not be as worrying as one might think. It is partly a consequence of increasing living standards. As our incomes increase, we spend more on services than on goods. The decreasing working-age population rate is also a consequence of increasing living standards. As incomes increase, people choose to have smaller families.
Dietrich Vollrath argues, in his book Fully Grown, that the declining growth rates in many high-income countries are signs of success. With higher incomes we tend to spend more on products that are produced by less productive industries, and we have fewer children which reduces the labour force. By decomposing GDP per capita growth, Vollrath finds that reduced growth in productivity and human capital make up for the declining GDP per capita growth rates.
Productivity growth is what is left after calculating the contributions of capital and labour to GDP per capita growth. It is a residual and therefore contains a lot of stuff that are hard to measure. Vollrath argues that the main part of the residual is explained by the American people’s choice to consume relatively more services than goods and to have smaller families. With increasing incomes, people consume an increasing share of services instead of goods and choose to have smaller families.
Vollrath analyses US growth rates. I look at Swedish growth rates to see if this also applies to Sweden. Below, I decompose GDP per capita in a similar way as I decomposed real labour earnings per capita here.
GDP Per capita = GDP per hours worked * hours per worker * employment rate * labour force participation rate * working-age population rate.
Following Hall (2017), I further decompose output per hour growth in into productivity growth and growth of the capital-output ratio.
Consuming less goods and more services changes our economy
As incomes increase over time, more is spent on services than on goods. The decreased demand for goods lowers the relative price of goods. The opposite occurs for services. The increased demand for services makes it more attractive to produce these. To meet the increased demand for services, firms in these industries want to hire more labour and need more capital to produce, store and sell them in large malls. The falling relative price of goods-producing manufacturing industries is accompanied by smaller shares of labour and capital, c.f. Figure 1.
Figure 1. Manufacturing relative price and shares of capital and labour in Sweden.

Source: Statistics Sweden. Industry shares of the capital stock are not available before 1993. I couldn’t find them at least.
The initial increase in Manufacturing industries’ share of the total capital stock is associated with the decision to abandon the fixed exchange rate 1992.
The reallocation of resources from Manufacturing towards Services changes the industrial composition of the economy. Services industries share of GDP has increased over time at the expense of Manufacturing industries.
This affects total growth. The larger the sector and the larger its growth, the stronger impact does the sector have on aggregate growth of GDP per hours worked. How much each of the industries, aggregate, contribute to total growth of hours worked is a combination of the weights they carry in total GDP, and their value added per hours worked growth rates. Since 1980, Manufacturing industries’ shares of total GDP decreased by eleven percentage point. More than that loss has been occupied by Market and Public Services. Since manufacturing industries’ shares of GDP has decreased, so has their contribution to total growth of GDP per hours worked, c.f. Table 1.
Table 1 Shares in GDP, growth of GDP per hours worked and industry contributions to total GDP per hour growth 1980-2000, and 2000-2019.
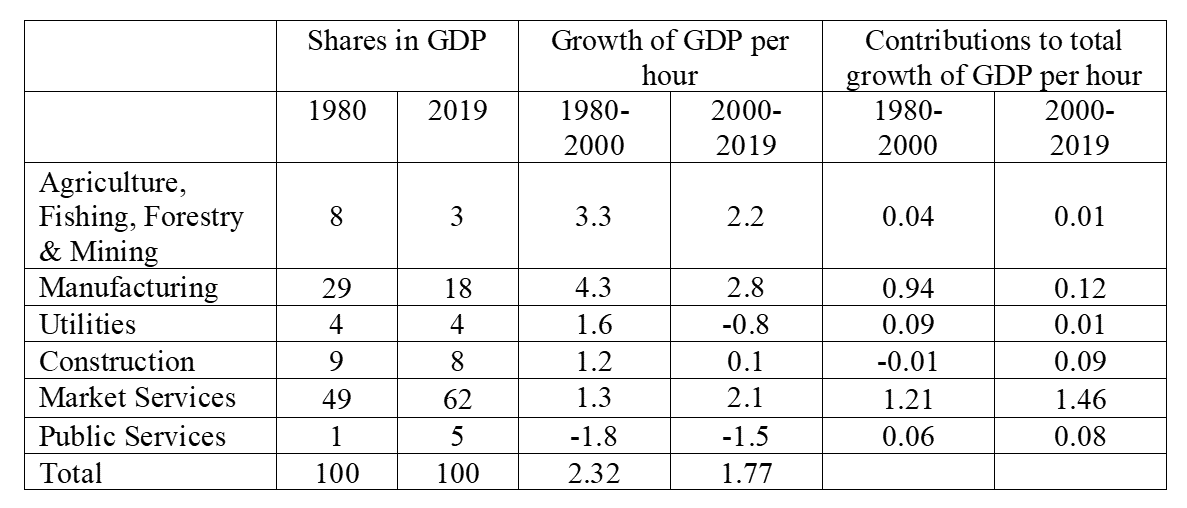
Source: Statistics Sweden. Note: Shares and growth in percentages, contributions to total growth in percentage pointsLack of data has precluded me from making the calculations further back in time. Look here for a description of how the calculations in Table 3 were made (https://gubbdjavel.com/2019/01/18/a-percentage-pointless-entry/
At the same time, while manufacturing growth declined, services industry growth increased. The growth in services industries is mainly a result of the growth in Information and Telecommunications services.
The decomposition of total growth of GDP per hours worked across industries shows that our choices to consume more services relative goods have caused the low-productivity industries to grow at the expense of high-productivity industries. This has consequences for overall growth of GDP per capita through the effect on GDP per hours worked.
Lower capital-output ratio and productivity growth accounts for most of the decreasing growth since the Millennium
Swedish GDP per capita grew on average by 2.3 percent per year between 1960 and 2000. Growth has been 0.9 percentage points lower since the Millennium. Most of the decline in GDP per capita growth is made up by the declining growth rates of GDP per hours worked. GDP per hours worked decreased by 1.3 percentage points after the Millennium compared by the period before the Millennium. Decreasing capital-output growth accounted for 0.3 percentage point of that while productivity growth declined by 1 percentage point, c.f. Table 2.
Table 2. Decomposition of GDP per capita growth 1960-2019 (%).
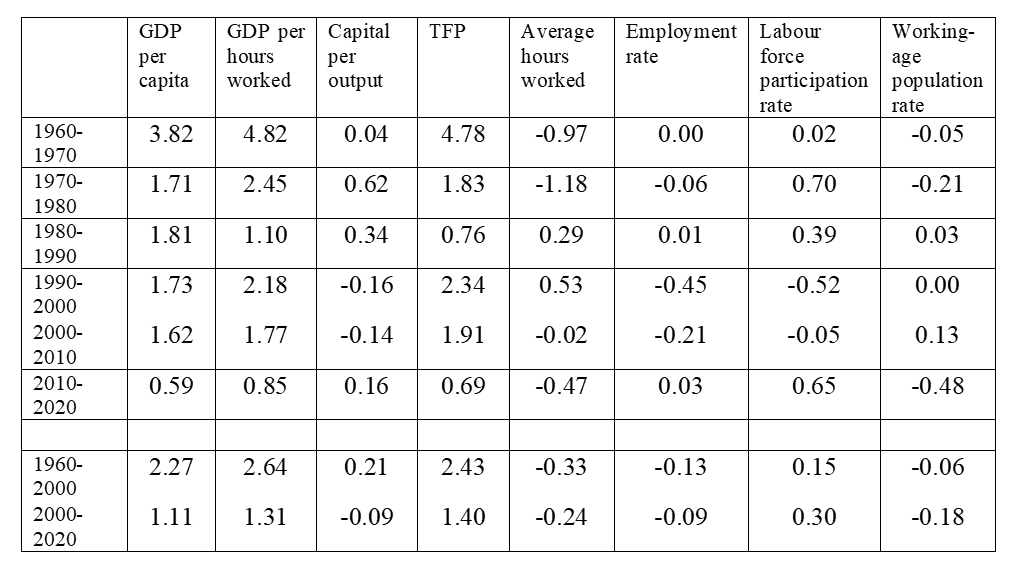
Source: Ameco Database. European Commission. Note: Averageannualised growth rates for all periods.
The capital-output ratio has decreased in all industries (which may be a topic for a later post). Compared to before the Millennium, average hours worked decreased less. The development of average hours worked closely follow developments in GDP per hours worked. Also, the employment rate and the labour force participation rate decreased less after the turn of the Millennium than before.
The growth of the working-age population rate did however decrease even more after the Millennium. This is also a consequence of our choices. People tend to choose to have fewer children as incomes increase. As time goes by, these choices change the demographic structure by making the population older. This means that fewer people must support more people. If this continues at the same time as growth declines, then we might have a problem.
As long as my human assistant brings food to my table, I really don’t care.

Other parts of the residual?
It seems inevitable that services industries’ share in the economy increases. Trying to prevent this is however a bad idea. The Covid crisis brought back a number of bad ideas such as Strategic Sovereignty and European Champions. Changes in industry structure are results of consumer preferences. Interventions in consumer choices affects the allocation of resources across industries that do not reflect our preferences and differ from how resources would be allocated according to their expected returns.
Some Market Services display high growth. As briefly mentioned above, that refers especially to Information and Telecommunications services. Hopefully, technological innovation such as AI, may improve growth in other services industries too. There are however more constraints to productivity in those. A robot may be able to play Smoke on the water twice as fast as Deep Purple but I’m not sure anyone would be willing to pay for that.
As mentioned above, productivity growth consists of a lot of stuff. A lot of work has been ploughed into analysing the effects of how competition affects productivity. Increased market power is believed to be bad for investments and innovation. To prevent new firms to enter the markets, there must be barriers for entry and exit. That opens the door for the role of regulations of the existing markets. Other focus on the role of inequality, decreased geographic mobility and more.
A smaller working-age population challenges future living standards but renewed growth may be around the corner
I will look more closely at the demographic changes in later posts. It is clear from the data that the decreased working-age population rate has had negative effects on growth. A decreasing working-age population rate adds more pressure on the rest of the population. If we want living standards to increase in the future, productivity growth needs increase to counterbalance the negative effects of a smaller working-age population.
Increasing the working-age population in the short run can only be done with immigration. We are however notoriously bad at integration. It takes years for immigrants to enter our rigid labour markets. The problem is exacerbated with a severely malfunctional housing markets. So, must future generations settle with mediocre growth rates?
Maybe not. As I hinted here, “…the future is bright. Or perhaps I should write green. See my previous post here and the references therein. Technological advances allow us to produce more with less which means that we use fewer natural resources and energy now than previously. We also need less energy and resources for transportation as many goods become smaller. And transportation methods have improved so more goods can be transported by less energy.”
Other bloggers also think that growth is about to jump back to previous levels. Read this and this if you’re interested in some techno optimism in bio-tech and health, information technologies, space, transportation and more.