Spoiler: Productivity growth is declining also in Estonia, Latvia, and Lithuania. Since they became free, and joined the EU, their GDP per capita growth rates have been remarkable. But. Declining productivity growth rates and ageing populations hamper the growth in also these countries. In order to continue the converge of GDP per capita towards U27, the Baltic countries’ productivity growth rates must increase because their populations are getting older. Older populations due to lower population growth is a problem in many countries. Are AI and solar power enough to compensate for fewer people?
In this post I will decompose and compare GDP per capita growth in the Baltic countries. After the collapse of the evil empire, aka Soviet Union, lives in Estonia, Latvia, and Lithuania have become richer, longer, and cleaner. The growth of living standards measured by GDP per capita has been spectacular in these three countries.
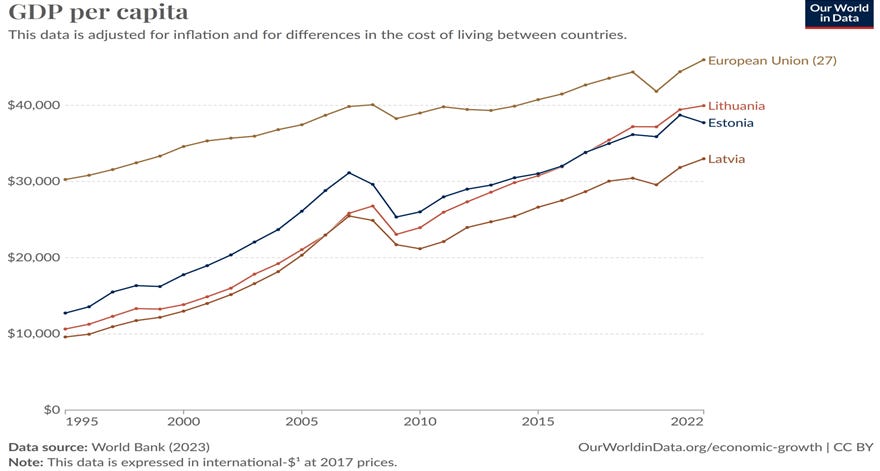
In 1995 GDP per capita in Estonia, Latvia and Estonia amounted to 40%, 30% and 40% of the average EU GDP per capita respectively. In 2022, they had reached 80%, 70%, and 90% of EU27 GDP per capita respectively.
Between 1995 and 2022 annual average growth rates in the three countries amounted to between four and five percent per year. In comparision, EU27 grew by 1.6 percent per year. The higher growth rates have decreased the distances between GDP per capita in the three countries to the average of EU27. But now GDP per capita growth rates are slowing down. The rest of this post will show, by means of a growth account exercise, which components of GDP per capita that account for the major parts of the declines.
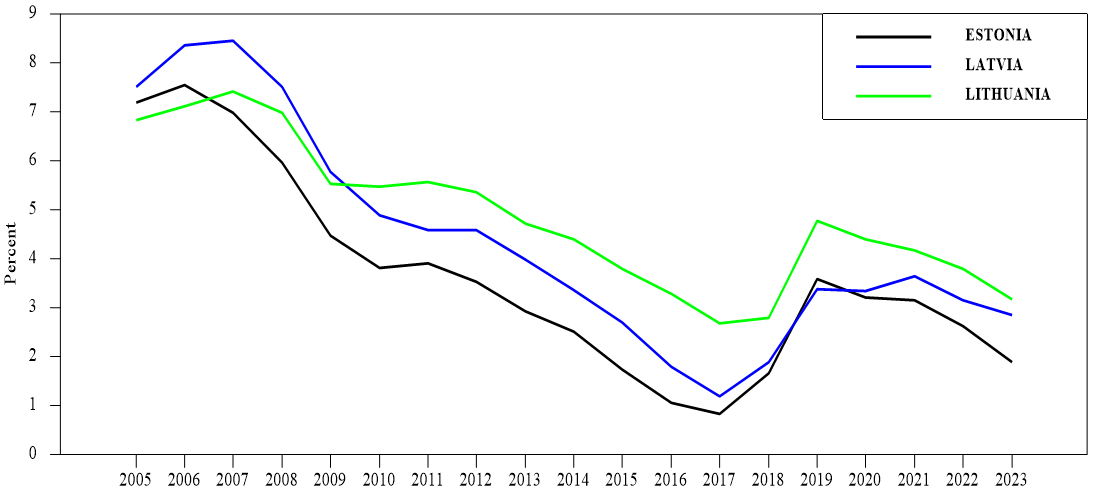
GDP capita growth 1995-2023.
Source: Ameco Database, European Commission. Note. Ten year average annual growth rates computed as .1*ln(yt/yt-10).
Before I begin, I will repeat that it is important to not mistake growth accounting for a casual analysis. Accounting explains nothing, it merely slices up the changes of GDP per capita growth into its components.
where Y denotes GDP, N population, and N15-64 denotes the working age population which is assumed to be between 15 and 64 years of age in all Baltic countries. Growth of GDP per capita, is therefore the sum of productivity growth, average hours worked, the employment rate, and the working age population rate. Below, I will sometimes refer to the three last components as human capital.
Human capital growth has not been large enough to compensate for the declining productivity growth.
Labour productivity growth is declining almost everywhere. This is a consequence of our increasing living standards as I have blogged about before. In those posts I wrote that declining growth rates of GDP per hours worked are a consequence of how patterns of consumption change when incomes increase. As incomes increase, demand shifts from goods to services. The relatively stronger demand for services leads to a reallocation of capital and labour towards these industries from goods-producing industries. The services industries shares of total GDP have incresed in all the three countries between 1995 to 2023 and now amount to more than 70%.
There is of course more factors at play explaining the declining labour productivity growth but. But the increasing shares of less productive sectors matter for the total productivity growth rates which have declined significantly over the past two decades.
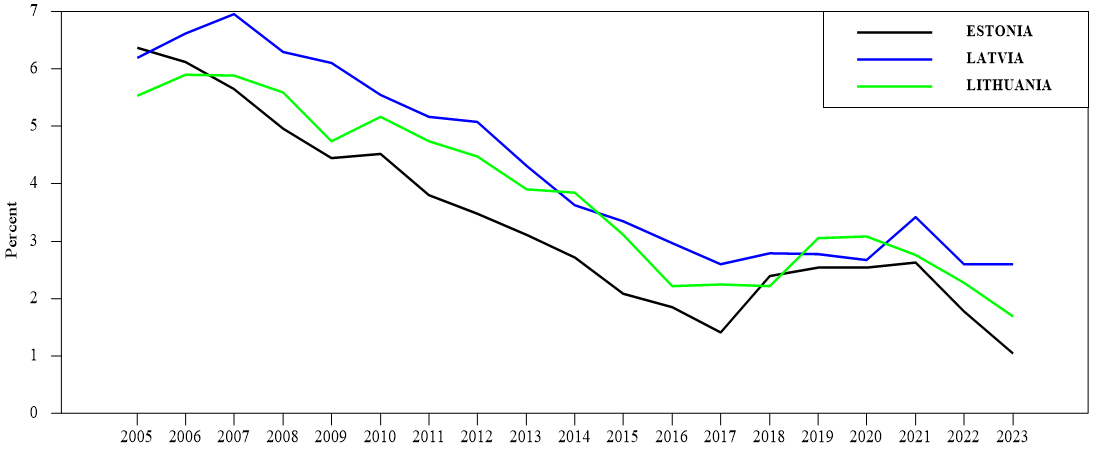
Labour productivity growth 1995-2023.
Source: Ameco Database, European Commission. Note. Ten year average annual growth rates computed as .1*ln(yt/yt-10).
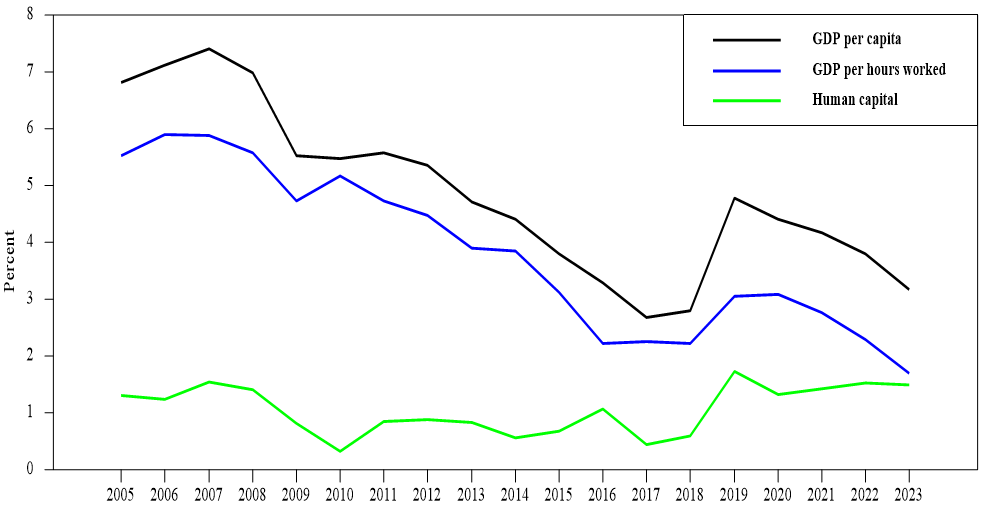
To keep GDP per capita growing at the same pace as ten or twenty years ago, growth of the other components, making up human capital, need to grow faster since productivity growth is declining. But the developments of human capital has not been enough to compensate for the declining labour productivity growth rates. Not even in Lithuania where human capital growth has been positive for the whole period of time.
Growth of GDP per capita, GDP per hours worked, and human capital in Lithuania 1995-2023.
Source: Ameco Database, European Commission. Note. Ten year average annual growth rates computed as .1*ln(yt/yt-10).
To see how the human capital stocks develops over time, one should decompose it since it may not be very interesting to see how hours worked relative to the total population changes since that includes people who not work. Below I will look at changes in average hours worked, the employment rate, and the working age population rate.
Just a reminder. I will discuss declining growth rates of GDP per capital below. This does not mean that GDP per capita is decreasing, only that it is growing slower than before. Also, even though i do not make any claims that growth accounting is explaining anything, and can’t be used as causal analysis, one should keep in mind that increasing prosperity gives us oppurtunity to make choices. With higher incomes, we can choose to work more or less. We can also choose to have smaller families. Also, higher incomes allows us to spend more on healthcare, more nutritious food, exercise more and other things that prolong our lives. As a result, the number of people aged 64 and older, increase. The choices above affect the developments of working hours, and populations.
Decomposing human capital growth
To better understand the variations in human capital, a decomposition is made below. As shown above, hours worked per capita, is the sum of three components, hours worked per employee, the employment rate, and the working age population rate.
To begin with, annual average growth rates 1995-2023 of GDP per capita and its components are presented.
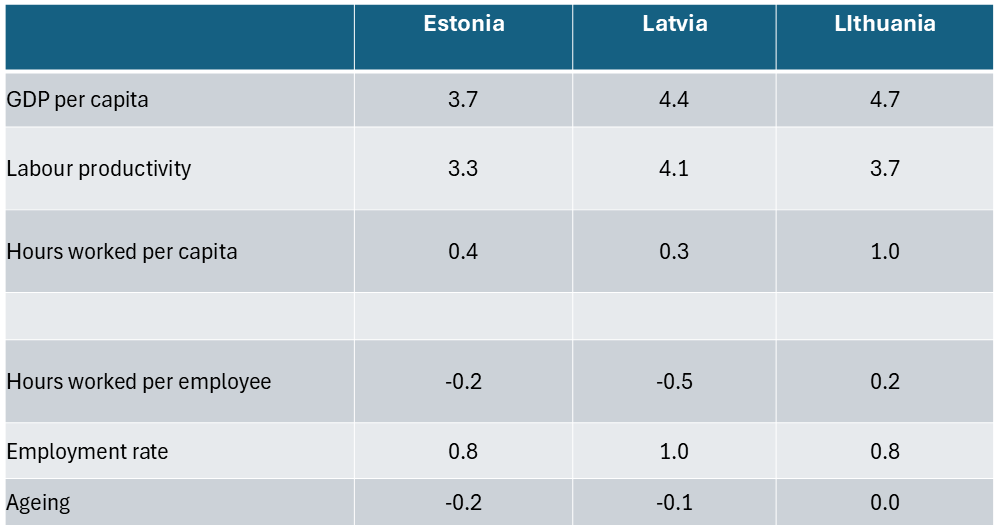
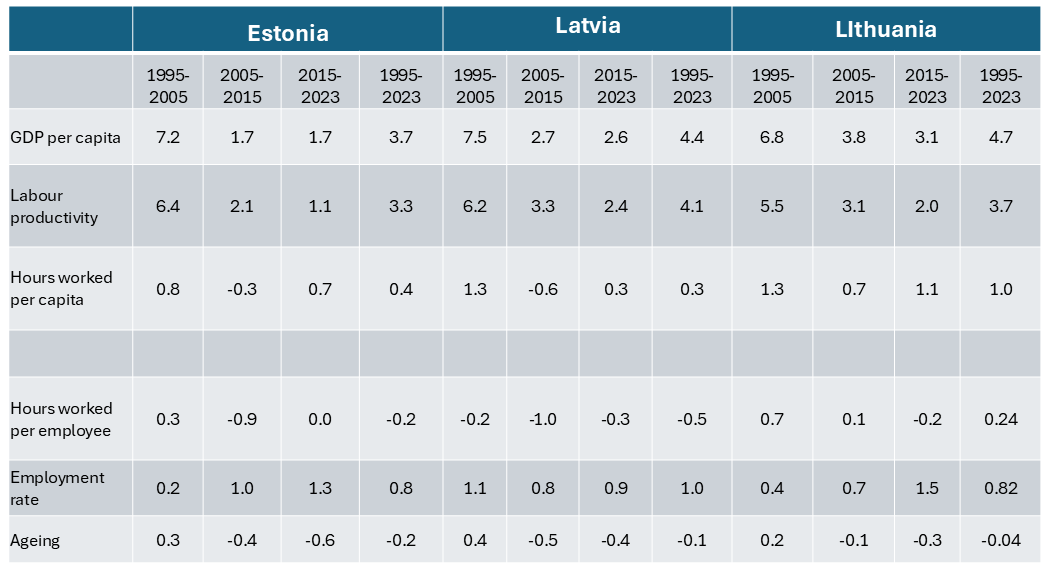
Growth accounting. Annual average growth rates of GDP per capita 1995-2023. Percent.
Source: Ameco Database, European Commission. Note. Ten year average annual growth rates computed as (1/28)*ln(yt/yt-28).
The developments of hours worked per employee differs between the countries. In Estonia, the increase in hours worked was smaller than the increase in employment. yielding declining hours worked per employee. In Lithuania, the increase in hours worked was larger than the decrese in employment, which resulted in increasing hours worked per employee. In Latvia, both hours worked and employment decreased. Since hours worked decreased more than employment, hours worked per capita decreased.
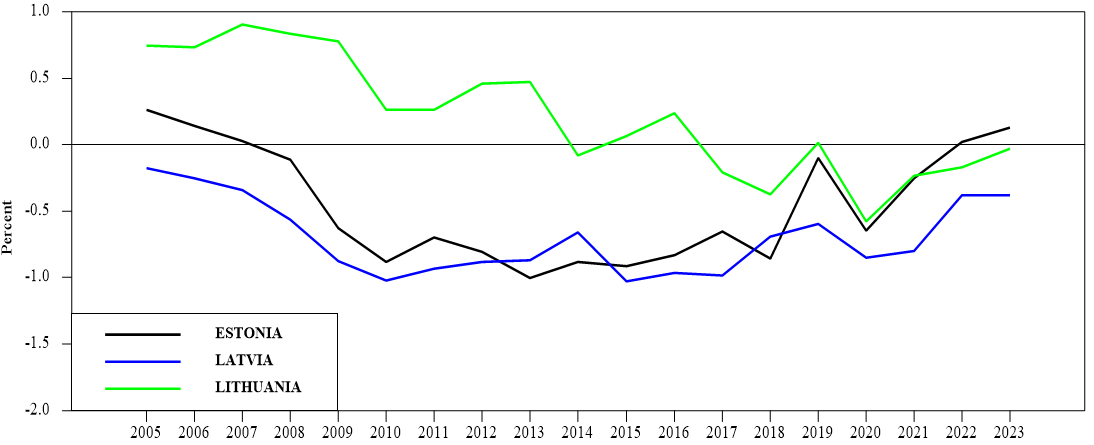
Graphing average annual ten-year growth rates allows for showing variations over time. Growth rates may turn positive in all three countries in the coming years.
Hours worked per employee growth 1995-2023.
Source: Ameco Database, European Commission. Note. Ten year average annual growth rates computed as .1*ln(yt/yt-10).
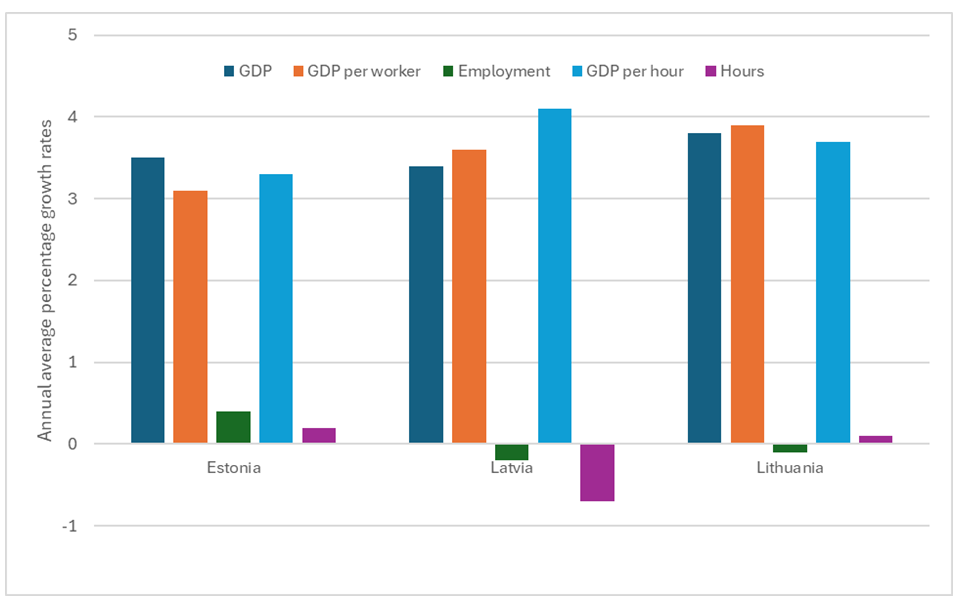
The variations in hours and employment imply that labour productivity measured as GDP per employed differs from GDP per hours worked. To highlight these differences across countries, I decompose GDP growth in two ways below: i) growth in GDP per worker plus emplyment growth and ii) growth in GDP per hours worked plus growth in hours worked. As noted above, employment grows only in Estonia, both hours worked and employment declines in Latvia, while only hours worked grow in Lithuania. The growth rates of both hours worked and employment in Lithuania are very small making GDP growth almost equal to growth in GDP per worker and GDP per hours worked. The relatively large decline in hours worked in Latvia pushes growth in GDP per hours worked up significantly above growth rates of GDP and GDP per worker. As employment increases more than hours worked in Estonia, growth in GDP per hours worked increase more than GDP per worker.
Decomposition of GDP growth 1995-2023.
Source: Ameco Database, European Commission. Note. Ten year average annual growth rates computed as (1/28)*ln(yt/yt-28).
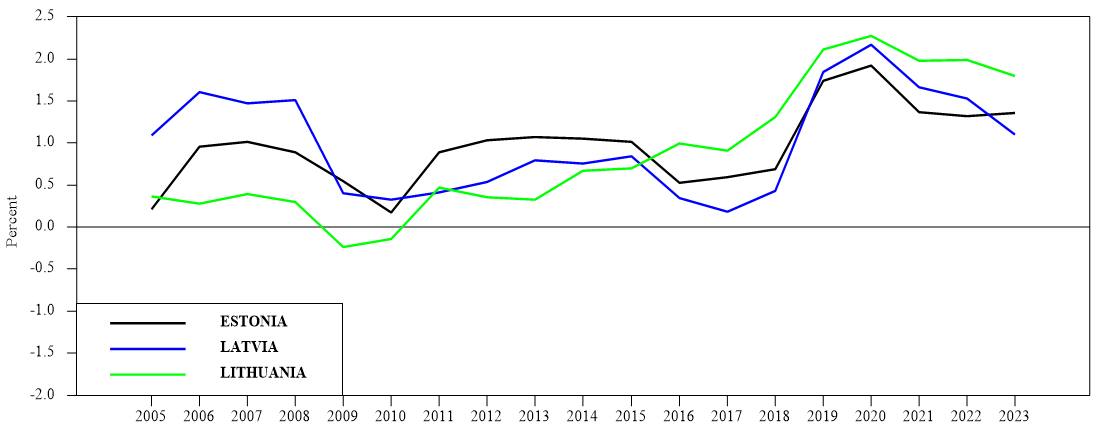
Next the employment rates. The employment rate is defined as employment relative to the population in the ages 15 to 64. An increase in this rate can be the result of i) employment increasing more than the working age population, ii) employment increasing and the the working age population decreasing, and iii) employment decreasing less than the working age population.
The working age population decreased in all three countries while employment increased only in Estonia. Of the three countries, Latvia witnessed the largest decline of the working age population, -1.1% per year between 1995 and 2013. The decreases in Estonia and Lithaunia amounted to -0.4%, and -0.9% respectively. Total employment increased between 1995 and 2023 in Estonia, 0.5% per year while it decreased in Latvia and Lithauna by 0.1% and 0.9% respectively. Therefore, the employment rate growth was higher in Latvia than in Estonia and Lithuania for the whole time period.
Employment rate growth 1995-2013.
Source: Ameco Database, European Commission. Note. Ten year average annual growth rates computed as .1*ln(yt/yt-10).
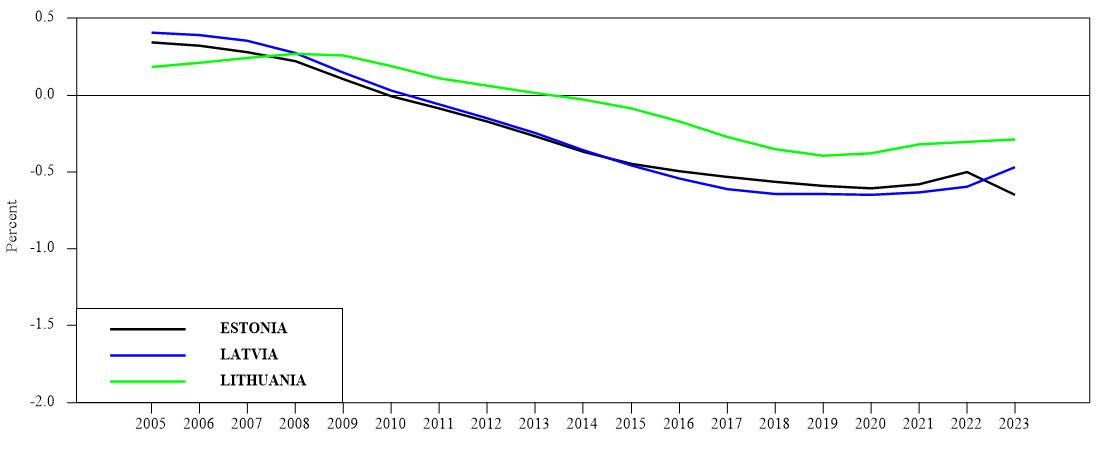
Finally, the working age population rate, called “Ageing” in the table above. The working age population decreased more than the total population between 1995 and 2023 in Estonia and Latvia while the decreases were almost equal in Lithuania. Graphing annual average 10-year growth rates gives more nuanced pictures of the developments over time.
The working age population rate has fallen since 1995 and been negative since 2011 for Estonia, and Latvia, and since 2015 for Lithuania. The largest declines are recorded in Estonia and Latvia while the declines in the working age population almost equals the decline in the total population in Lithuania for the whole period.
Working age population growth 1995-2023.
Source: Ameco Database, European Commission. Penn World Table, Groningen Growth and Development Centre. Note. Ten year average annual growth rates computed as .1*ln(yt/yt-10).
As you have noticed by looking at the graphs above, there is a lot of variation across time in each of the three countries.
Growth accounting. Subperiods and total time period. Annual average growth rates of GDP per capita 1995-2023. Percent.
Source: Ameco Database, European Commission.Note. Ten year average annual growth rates computed as .1*ln(yt/yt-10). Eight year average, 2015-2023, calculated as (1/8)*ln(yt/yt-10).
Future lower populations, future less ideas and future lower growth.
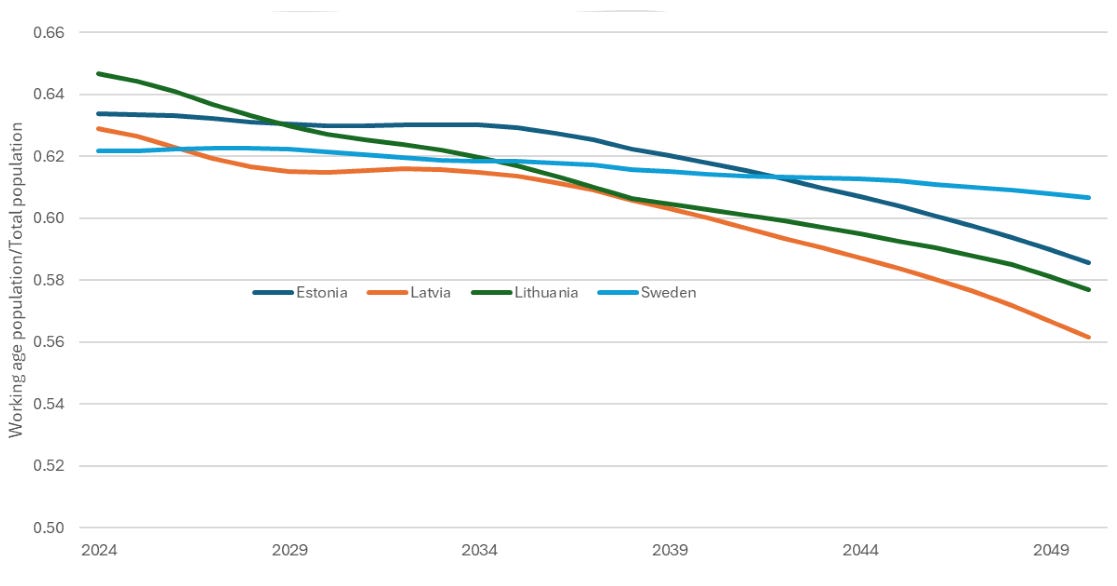
As the graphs and the table shows, ageing populations in the three countries will impact negatively on future GDP growth. According to Eurostat’s baseline population scenarios, the working age populations in Estonia, Latvia, and Lithuania will decrease by 0.3%, 0.44%, and 0.44% per year between 2024 and 2050 respectively.
Future working age population rates in Estonia, Latvia, Lithuania, and Sweden 2024-2050.
Note that, according to Eurostat’s projections, the Estonian working age population rate will be higher than in Lithuania in a few years. The Swedish rate is included as comparison.
The lower working age population will have negatively impact on future GDP growth also through other channels. Shrinking working age populations mean that smaller shares of populations support increasingly larger shares of populations. More money need to be spent on elderly care, health care, and related products because more resources need to be allocated for attending ageing populations. Unless productivity increases dramatically, those expenditures will come from more and higher taxes on the working population. That affects growth both through the allocation of resources and lower savings.
Savings will also decrase as a result of the changed demographic structure. People save more during their working ages than when they are young or retired. Lower savings imply that investments will be lower which in turn will mean that the future capital stock will be lower than if the working age population was larger.
There is also an effect on future growth from less ideas. A smaller working age population is the result of lower population growth. As Paul Romer has shown, some people are clever and come up with ideas that are transformed into innovations and new products that can be used by a lot of people once innovated. This means that the income per person generated by ideas depends on the total stock of ideas. Income per person generated by physical capital depends on the capital per person.
Most ideas come from people working very hard in universities, research institutes, and company laboratories. With fewer resarchers, we will have fever ideas and lower growth.
Can we get out of the ageing trap?
Either we start to make more babies immediately or we begin to hatch more ideas in a quanttity large enough to compensate for the lower population growth. But, Ideas are getting harder to find. AI will make it easier but AI does not come free. It requires capital, labour, and energy.
Hopefully, solar power in combination with more efficient and cheaper batteries will help us as I rambled about here.
AI.
Lots of people think that AI will be the new panacea and lead to two-digit growth rates. I doubt it. Productivity growth is basically about ideas. Ideas that either makes it possible to produce new stuff with the same amount of inputs as before or make the same amount of stuff with a lower amount of inputs. Before new stuff can be made, resources must be allocated to implement the ideas, that is R&D. R&D does not come about by itself, the processes need resources, i.e. capital and labour of different kinds and qualities. Even if AI can significantly increase the number of ideas, the R&D still needs resources to transform those ideas into products. And ideas have been harder to come by as shown here.
But AI will increase productivity growth and make R&D easier. It can substitute chips for people. But new also AI in chips require more energy, capital, and labour. More resources. This means that if AI should make a difference, we need cheap energy.
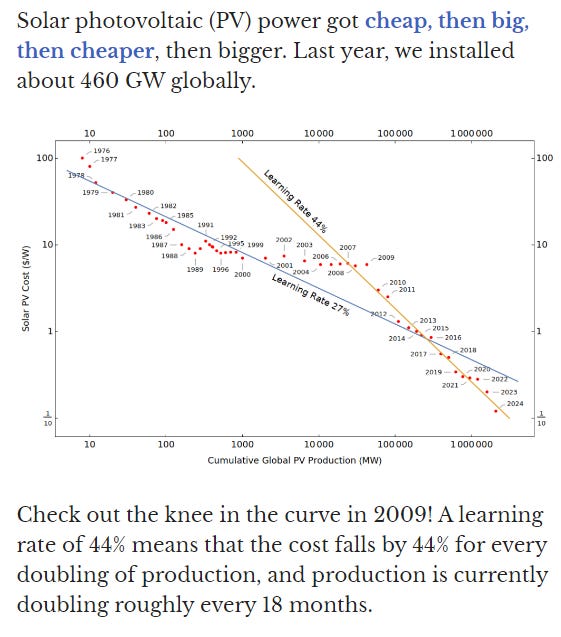
Cheap energy is on the horizon. Or even closer. Here is a screen dump from Casey Handmere’s blog. In the post from which I made the screen dump, he shows how cheap and big solar energy has become. And then he goes on to to list industrial applications of cheap energy, together with a prescription for their transition to solar as a fundamental source of energy, and estimates of their economic value.
Spoiler: As shown in a previos post, the declining Manufacturing Industries’ growth has been part of the explanation behind lower GDP per capita growth. Also, the lower weight of Manufacturing in the economy contributes to this. This post looks into industries whose weights in the economy are increasing, Information & Communication services. The growth …