Spoiler: In 1948, when the commie rats took control over Czechoslovakia through a coup d’etat backed by the kremlin, GDP per capita in Czechoslovakia was higher than in Austria.
I smell a commie rat
Source: Youtube.
At that time, goods, people and capital were flowing across the border between the two countries for the benefit of their populations. After the coup, the Austrian economy left Czechoslovakia far behind. Austria flourished as a market democracy free to trade with other countries while the communist shackles restrained Czechoslovakia and forced her to trade with other members of the Eastern bloc. In 1989, Czechoslovakia became free again and peacefully decided to split into Czechia and Slovakia in 1993. Freedom has been good. Growth is much higher and GDP per capita in the both countries are approaching Austria’s. Even so, in 2022, Czech and Slovak GDP per capita only amounted to 74% and 63% respectively of Austrian GDP. Using Maddison data to calculate the price of communism shows that in absolute terms, measured in US dollars 2011 prices, communism costed average Czechs $11, 545 and average Slovaks $16,274. In 2022 that is. The correct costs of in terms of GDP are the accumulated differences in GDP per capita from 1948 to 2022.
The costs in terms of lost freedom, worse environment, shorter lives, deportations and murders are much, much higher.
Between 1920 and 1937 GDP per capita in Austria and Czechoslovakia grew on average by 1.6% and 2.45% per year respectively. During the 17 years after the coup in 1948, GDP per capita grew on average by 6.2% and 3.5% respectively. In 1948 GDP per capita in Czechoslovakia exceeded Austria’s GDP per capita by 12%. In 1989, at its peak, GDP per capita in Czechoslovakia amounted to a litte more than half of Austrian GDP per capita.
In parity with Austria when the commie rats took over.
Between 1920 and 1937, GDP per capita growth in Czechoslovakia closely followed Austria’s. After the coup in 1948, the countries diverged strongly.
GDP per capita for Austria and Czechoslovakia 1920-1989. Index 1920 = 1.
Source: Maddison Project Database. Note: GDP per capita in 2011 dollars.
Growth after communism.
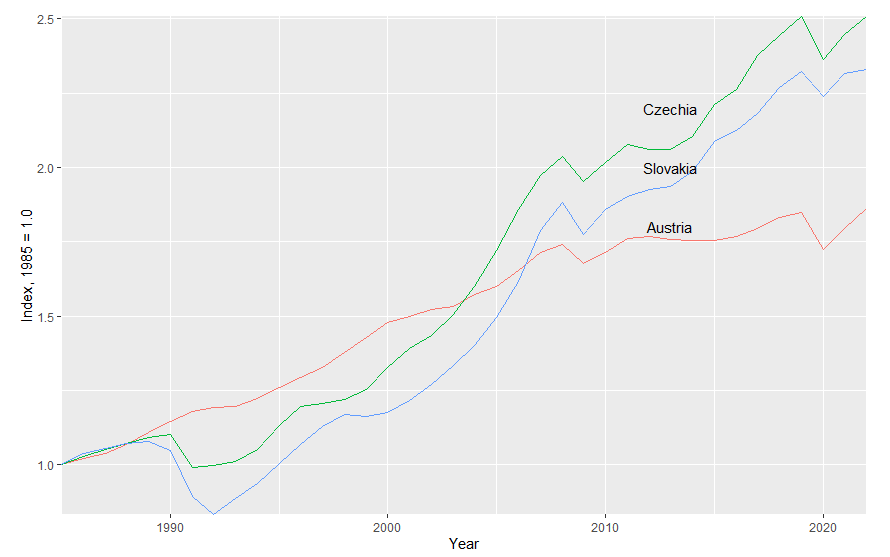
Freedom is good. Between 1993 and 2010 (17 years again), Austria grew on average by 2.1% per year while Czechia and Slovakia grew by 4.2% and 4.4% respectively. Notice the astonishing difference in growth rates after the Global Financial Crisis. Austrian growth has stagnated at 0.7% per year while Czechia and Slovakia has grown by 1.8% and 1.9% per year between 2010 and 2022.
GDP per capita for Austria, Czech Republic, and Slovakia, Index 1985 = 1.
Source: Maddison Project Database. Note: Index of GDP per capita in 2011 dollars.
The uselessness of the planning economies is widely known. It made life in communist countries shorter, poorer, and dirtier than in market economies as I wrote about in this post.
Life under communism was shorter, poorer and dirtier than in the west
Spoiler: Communist leaders promised people in their countries to build socialist paradises. But life in the Soviet Union and its satellite states were miserable. People were poorer and did not live as long as people in the west. People in communist countries died earlier not only because of the mass executions, slave labour in- and outside of prison cam…
A quote from the above post
The communist regimes had a well elaborated Plan which created perverse incentives which inhibited innovations, made quality improvements costly, cost reductions meaningless but encouraged waste. In the communist economic system where factors of production were not allocated and rewarded according to their productivity, the result could only be inefficiency, waste and shortages.
The plan’s incentive structures were the real problem behind the disappointing economic development, low technical progress and the environmental destruction and administratively determined prices, soft budget restrictions and absence of property rights were key ingredients in the recipe for failure.
But there was some creativity in the system after all as Kragh (2014) and Svensson (2017) illustrate with some examples. Production targets were specified in terms of tons. Firms that were ordered to produce furniture, produced as heavy chairs, tables, beds and sofas as possible. Transportation firms could have targets specified in number of kilometre tons. Those firms met their targets by filling their trucks as much as possible and had their trucks driven back and forth on the same road until their targets were met.
No, growth did not increase inequality in Czechia and Slovakia
Sometimes one can read that inequality increases in fast growing countries according to the Kuznets curve. Those of you who read my post about inequality in Estonia, Latvia, and Lithuania may remember the graph showing GINI-coefficents. Here it is again but now highlighting Czechia and Slovakia instead. Measuring inequality with Gini’s shows that Slovakia is the least inequal in the EU and that inequality in Czechia is also low.
GINI coefficients in EU in 2023.
Source: European Commission, Eurostat. Note: Gini coefficents for equivalised households’ disposble incomes.
Will Fico fuck up Slovakia?
However, all is not well. The Slovakian prime minister Robert Fico, allegedly once a social democrat, has turned rogue. His pro-muscovite stance shows up in demanding an end to military aid to Ukraine and announcing that he will attend in moscow next year side by side with the internationally wanted criminal and illegitimate muscovite “president”. Fico gets his inspiration not only from the fascist in chief in the kremlin, but also from his neighbour, the corrupt Orbán, who has transformed Hungary to an autocracy. Following in Orbán’s footsteps, Fico has begun to attack the media, the academia, the civil society organisations, and take control over the judiciary. Time will tell if he remains in power and transforms Slovakia to a corrupt autocracy just like Orbán did to Hungary.


Thanks for a comprehensive and insightful analysis.