


Yellow vests without a case.

Spoiler: The Yellow Vests' claims that inequality in France is increasing are not justified. Wages constitute the most important share of total incomes and real earnings per capita kept growing despite the Financial crisis. Nor did labour shares in total GDP decrease and real wages increased more than labour productivity. And no indicators indicate that inequality has increased.
In fact, France also has one of the most generous welfare programs in the OECD which hasn't prevented the Kremlin to spread lies and pay people to demonstrate and riot.
The demonstrations in France, organised by the Yellow vests, have received a lot of attention. Fuelled by sharp increase in fuel taxes, the demonstrators have increased the scope of allegations and demands. Claims have been made that large parts of the population have suffered a lot since the Financial Crisis and that France is characterised by large income and wealth gaps. But is this true? Has inequality in France increased dramatically? Are income and wealth distributed less equal in other countries? I will try to answer those questions in this post which begins with comparisons of developments in France to developments in Germany, Italy and Spain.
France was less hit by the Financial crisis and recovered faster
Let’s begin with a recap of the economic developments since the turn of the Millennium. France, Italy and Spain experienced high growth from the beginning of the Millennium until the financial crises while Germany went through a small recession in the beginning. GDP increased until the Global Financial Crisis in all countries. Following that year, GDP decreased two years in a row in Italy. Neither France nor Germany experienced “the double dip” that plagued Italy and Spain, c.f. Figure 1.
Figure 1 GDP 2000-2019 in Germany, Spain, France and Italy.
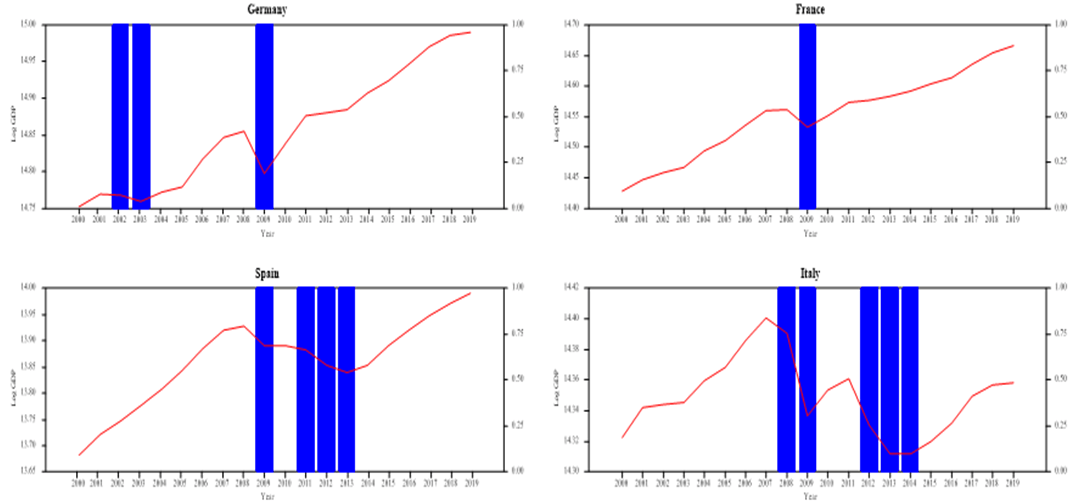
Source: European Commission AMECO Database. Note: A bar shows that GDP decreased compared to the preceding year.
The lower growth since the Financial crisis, or even earlier, means that incomes of ordinary people could potentially grow less and even decline. Since most of the incomes of ordinary people is in terms of wage income, this post begins to study developments of labour income measured as real labour earnings per capita between 2000 and 2019.
French real labour earnings per capita were hardly hit by the crisis and continue to grow afterwards
Real labour earnings per capita grew steadily in all countries but Germany until 2008 when the Financial Crisis broke out. While French and German real labour earnings reached the pre-crisis level soon afterwards, real labour earnings per capita remains lower in Italy and Spain, c.f. Figure 2.
Figure 2. Real earnings per capita 2000-2019.
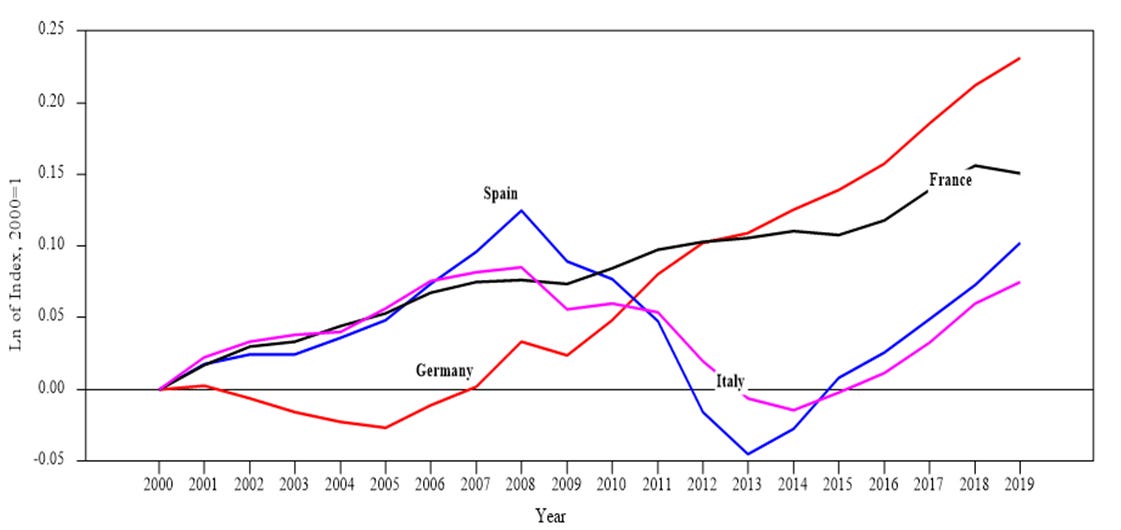
Source: DG ECFIN AMECO Database. Note: All series are shown as logs of an index, which equals 1.0 at 2000 so the series start at zero. Since the vertical axis is in log units, the slopes of the series are the rates of growth. An increase of 0.1 is a growth of 100*(exp(0.1)-1).
French real labour earnings increased by 16 percent over the whole time period. A country can become more unequal even when incomes increase for everyone if incomes for the richest part of the population increase more. The graph above doesn’t exclude any of these possibilities but it seems to exclude a third cause of inequality: decreasing incomes for the poorest and increasing incomes for the richest.
French real wages have outpaced labour productivity
Let’s look further into wage developments. Increased inequality is often associated with worsening of wage developments. This could be the case if developments in real wages fall behind labour productivity growth. It could also show up in a decreasing labour share, i.e. total wages share in GDP. This seems however not be the case in France where real wages have grown faster than labour productivity and labour shares have increase since the year 2000, c.f. Figure 3.
Figure 3. GDP per hours worked, real wages and labour shares in France2000-2019.
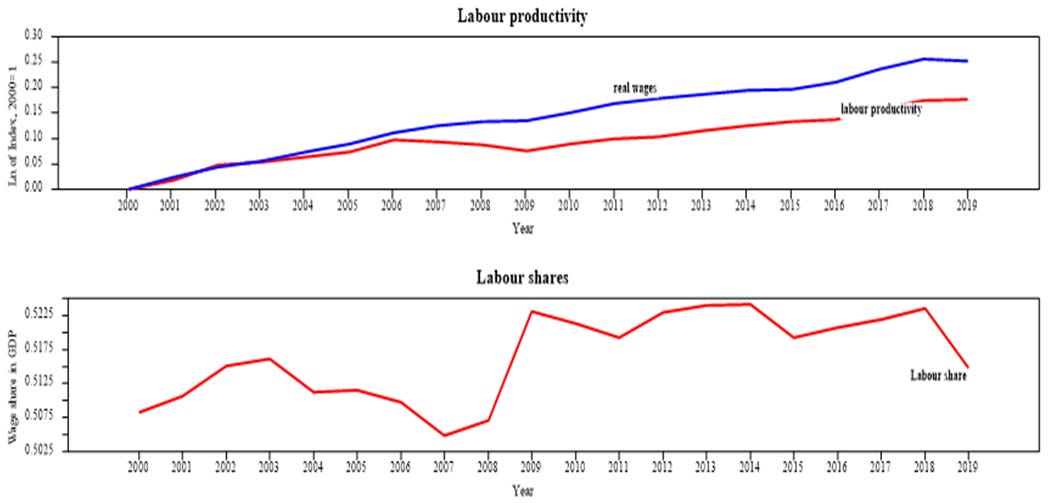
Source: DG ECFIN AMECO Database. Note: The series in the top panel are shown as logs of an index, which equals 1.0 at 2000 so the series start at zero. Since the vertical axis is in log units, the slopes of the series are the rates of growth. An increase of 0.1 is a growth of 100*(exp(0.1)-1). The labour share is defined as share of total wages in GDP.
Neither income nor wealth inequality is increasing in France
Even though labour shares have increased since 2000, they have declined slightly since the Global Financial Crisis broke out. It might be the case that the inequality has increased since then since the unemployment has increased during the same period from 7.4% in 2008 to 8.5% in 2019. Inequality can be measured in different ways, by the GINI-coefficient or by shares of total income and wealth for different parts of the population. No matter which indicator I use, I can’t find any sign of any large increase in inequality in France. Nor can I find that the risk of poverty has increased, c.f. Figure 4.
Figure 4. Inequality in France since 2000.
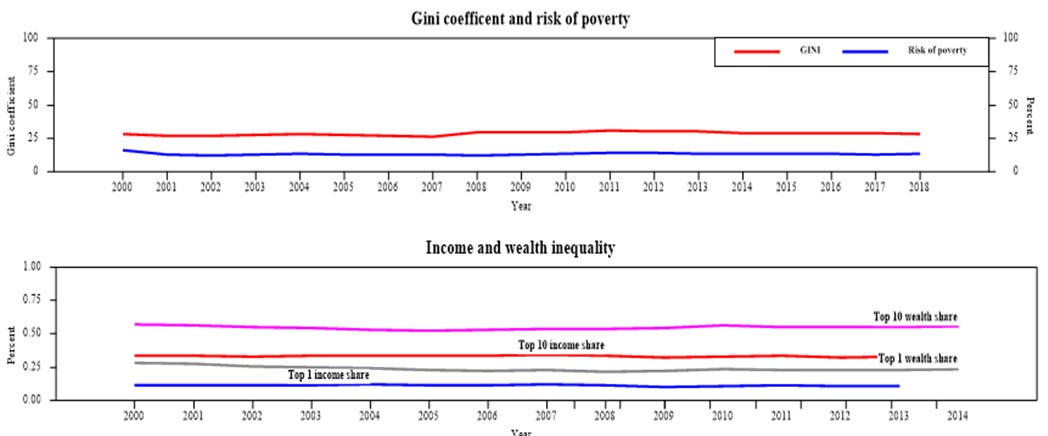
Sources: Gini coefficient and risk of poverty. Eurostat database. https://ec.europa.eu/eurostat/data/database. Income and wealth inequality. World inequality database, https://wid.world/ Note: Gini coefficient of equalised disposable income (households). Risk of poverty is defined as the share of persons with an equivalised disposable income below 60 % of the national median equivalised disposable income (after social transfers). Top 1, top 10: The richest one and 10 percent’s people’s share of total income and total wealth respectively.
And France has one of the most generous welfare systems in the OECD
Breaking down total disposable income growh in income deciles for the time period 2000-2017, shows that incomes did decrease slightly for people in the three lowest income deciles but also for people in the highest income decile. This is surprising and contrary to developments in most other countries. Capital incomes have increased in most countries since the Financial Crisis, for example in Sweden which I showed here. But the top French income earners have seen their incomes decline since 2008, c.f. Table 1.
Table 1. Annual average growth rates of equalised disposable incomes 2000-2017, 2000-2008 and 2008-2017 for income deciles.
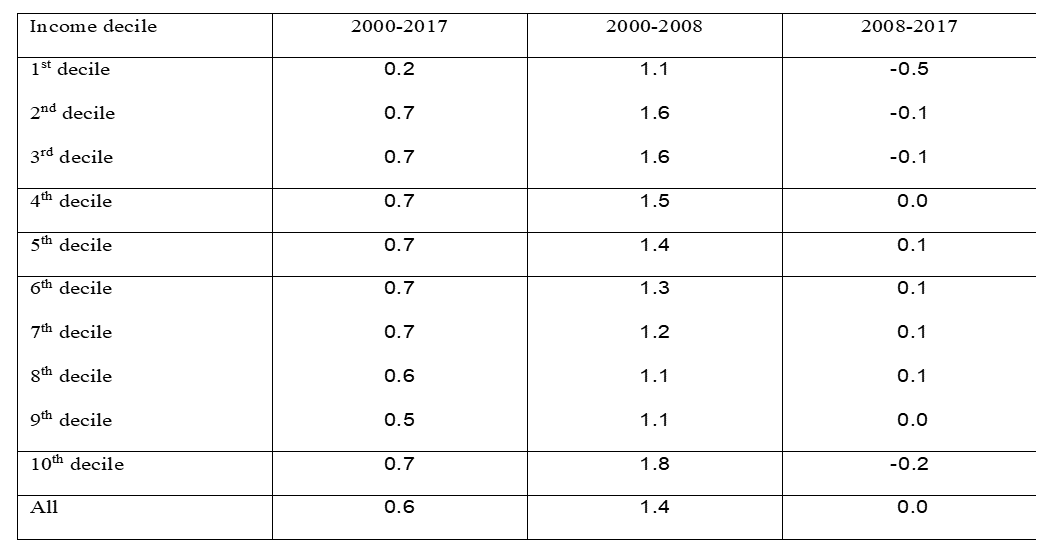
Source:www.insee.fr/fr/statistiques/2417897#tableau-figure1. Note: Constant 2017 prices.
Declining incomes for the three lowest deciles may indicate regional variations in income growth. Incomes are normally lower in rural areas. And it was also people from rural areas that were most affected by the tax-induced increase in fuel prices. Squeezed by lower incomes, higher expenditures due to fuel taxes, made the Yellow Vests turn to the streets. And in fact, GDP in less populated regions have not caught up with the more populated regions in France since the Financial Crisis. This shows up in a somewhat larger variation of income across NUTS3 regions in France, c.f. Figure 5.
Figure 5. Coefficient of variation of regional GDP in France 2000-2018.

Source: Eurostat. https://ec.europa.eu/eurostat/data/database
Even if Table 1 indicates some negative developments for the lowest incomes and Figure 5 indicate a tendency to regional divergency since the Financial Crisis, is it nevertheless difficult to claim that inequality in France is a serious problem. It is not only my perception but one that is shared by the World Bank. And according to the OECD, French citizens enjoy comprehensive health care under a national insurance program. Only Denmark, Belgium and Sweden have more generous welfare programs in terms of shares in GDP.
Which doesn’t stop Kremlin from paying people to claim the opposite
In short, my answer to the questions I posed in the beginning of this post is that inequality in France has not increased. That was easy to find out if you believe that facts matter. But facts do not matter if you are employed by Sputnik or RT. Neither of those belong to the serious media which has been shown so many times including here and here. And since quite a few of the Yellow vests seem be employed by the Kremlin as shown by over and over again, for example here and here, one should take the claims by Yellow vests with a mountain of salt.
Read more:
Causa, O. and Hermansen, M. (2019). Income redistribution through taxes and transfers across OECD countries. OECD. Working paper No. 1453.