


When the Corona virus hit the fan

Spoiler: This is the mother of all cluster fucks.
This is a meaningless post which I wrote for my own distraction but that didn't work
I hate this post. So, it’s going to be very short. I wrote it purely for my own therepeutical reasons. You should probably stop reading now. The post doesn't really contain any meaningful information.
There are plenty of economists and wannabee-economists speculating about the effects and duration of this shit. I’m not going to add to that because this is unpredictable. If you can read Swedish, you can go to economistas.se for some intelligent reasoning.
I just want to show a few things. Every industry is hit but some industries are hit earlier than others and some are hit harder than others. All industries are dependent on other industries, either as buyers or suppliers of their goods. That means that any chock hitting industry A will have effects on other industries.
Oh yeah, it's a chock alright
This shit is both a demand and supply chock. A decreased demand of industry A’s products (goods and/or services) will affect other industries since industry A needs intermediate goods from other industries to produce its product. This can be illustrated with input-output (IO) tables.
The latest available Swedish IO-table refers to the situation 2016. This one allows you to calculate output multipliers for every industry. Industry A’s output multiplier shows the total effect on production in the economy due to an increased demand of one SEK for industry A’s product.
The output multipliers are calculated from a Leontief matrix and presented in descending order together with each industry’s share of total production. The industries with the largest output multipliers have relatively small shares of total production. Some of the industries that have been most hit so far are Air Transport (H51), Hotels and Restaurants (I) and Motor Vehicles (C29). Their output multipliers are 1.7, 1.7 and 1.6 respectively. Motor Vehicles’ share of total production is rather big, 5.4% while the other industries’ shares amount to some 0.5% and 2% respectively, c.f. Figure 1.
Figure 1. Swedish industry output multipliers (left axis) and shares in percent of total production right axis) 2016.
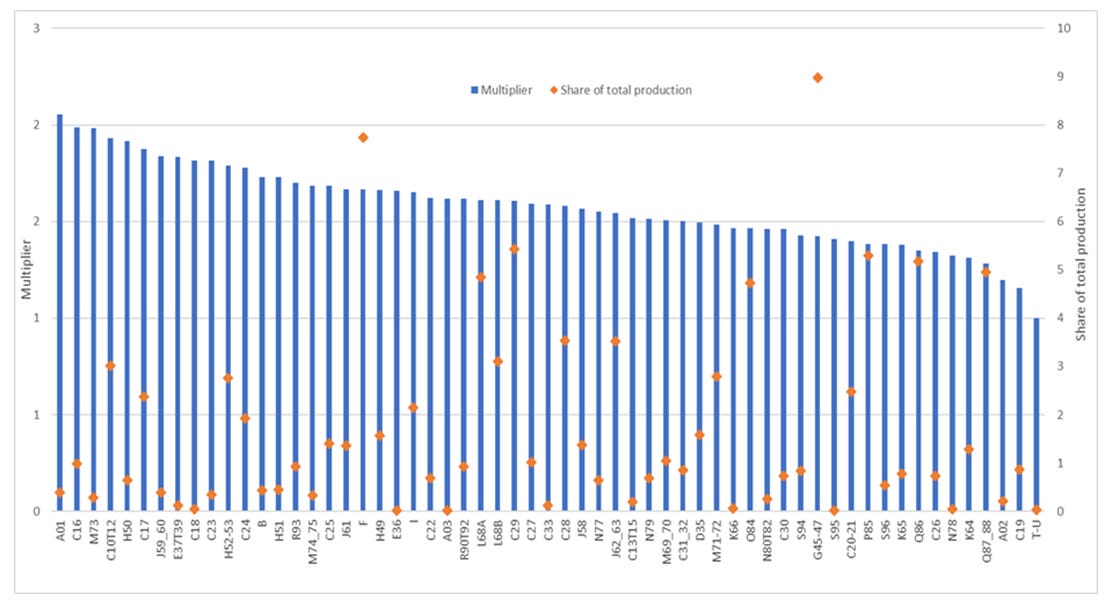
Source: Statistics Sweden, https://scb.se/hitta-statistik/statistik-efter-amne/nationalrakenskaper/nationalrakenskaper/nationalrakenskaper-tidigare-definitioner/pong/tabell-och-diagram/input-outputtabeller-2008-2016/
Each industry’s multiplier is larger than one since its own production is taken into account. I could of course have decomposed each industry’s total multiplier into contributions from all other industries. But that’s depressing.
I may be stupid but I'm not going to pretend to be able to show any effects of this shit on employment.
If you like, you could translate the output multipliers into employment multipliers by pre-multiplying the Leontief by a vector containing each industry’s employment-output ratio. That produces each industry’s employment multiplier which yields the amount of labour necessary to satisfy an increase of one SEK of an industry’s final demand. I’m not going to do that because this would give a false impression of precision. Also, it would only, as the figure above does, show a static view of the interdependence between an economy’s industries. Large shares of total employment are found in Retail and Wholesale (G45-G47), Construction (F), Supporting Services (N78-N82) and Hotels and Restaurants (I), c.f. Figure 2.
Figure 2. Swedish industry shares in percent of total employment 2016.

And this is where this post ends. Almost. In case you’re interested you can do the same thing for any country by using that country’s input-output table. They’re available on national statistics agencies’ web sites. Or you can go to oecd.org or wiod.org and make the calculations on multi-country input-output tables.
Such calculations will make you even more depressed than the above made me because they would give you larger multipliers as they also take into account of industries across borders. In any case, calculations like these only give a static view and we see a lot of dynamics going on now. And these calculations do not show the effects of uncertainty for consumers and firms.
In case you insist, here are two examples, from Denmark, of how input-output analyses have been used for trying to analyse the effects of the corona virus, c.f. Figur 3.
Figure 3. Input-output analyses in analyses of impacts of the corona virus.
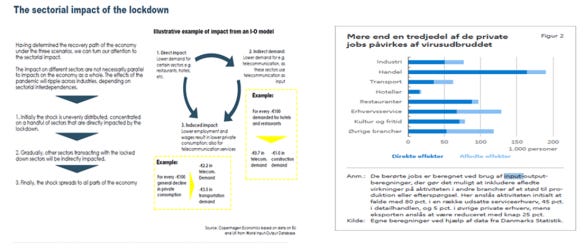
Source: Copenhagen Economics, https://www.copenhageneconomics.com/publications/publication/economic-consequences-of-the-covid-19-pandemic, (left), The National Bank of Denmark, http://www.nationalbanken.dk/en/publications/Documents/2020/04/ANALYSIS_No%204_Danish%20and%20international%20economy%20hit%20by%20pandemic.pdf
At least, the calculations provided me a bit of distraction from the shit that’s going on. Fan i helvetes djävla förbannade skit as we used to say up north.
Read more:
Miller, R.E. & Blair, P. D. (2009). “Input-output analysis. Foundations and extensions”. http://www.usp.br/nereus/wp-content/uploads/MB-2009-05-Ch-2-Found-I-O-Anal.pdf