


What ever happened to Italy, happened in Italy

Spoiler: This post is a follow-up of a previous post and begins with the text and the graph of that post. That post showed that the Euro has had nothing to do with the poor developments of Italian exports. Instead, Italy has structural problems which date back a long time. A symptom of those problems is the low labour productivity and total factor productivity growth rates relative to the other countries who joined the Euro area at the same time as Italy, the EA12 countries.
Larger countries export less in shares of GDP than small countries, since the larger the country, the more industries which produce goods and services. It follows that the smaller the country, the more open is it to external trade. A country’s “openness” is usually defined as the country share of exports in its GDP, its export share. The larger that ratio, the more open is the country. And if the above is correct, the smaller is the country too.
An implication of this is that it should be possible to assess whether a country’s actual export share equals the export share it should have given the size of the country. This can be done by regressing a country’s export share on a constant and the country’s GDP. This fitted value shows the potential export share of a country given its size. Which I just mentioned above. Getting senile by the minute it seems.
Before I repeat myself more, let’s compare Italy’s actual export share to its potential export share. If the euro has indeed made Italy less “competitive”, whatever that means on a country level, Italy’s export share would begin to decline relative its potential export share sometime around the introduction of the euro.
However, already since 1980 was the Italian actual export share well below its potential export share. The euro has had nothing to do with it, c.f. Figure 1.
Figure 1. Actual and potential Italian exports in GDP(%).
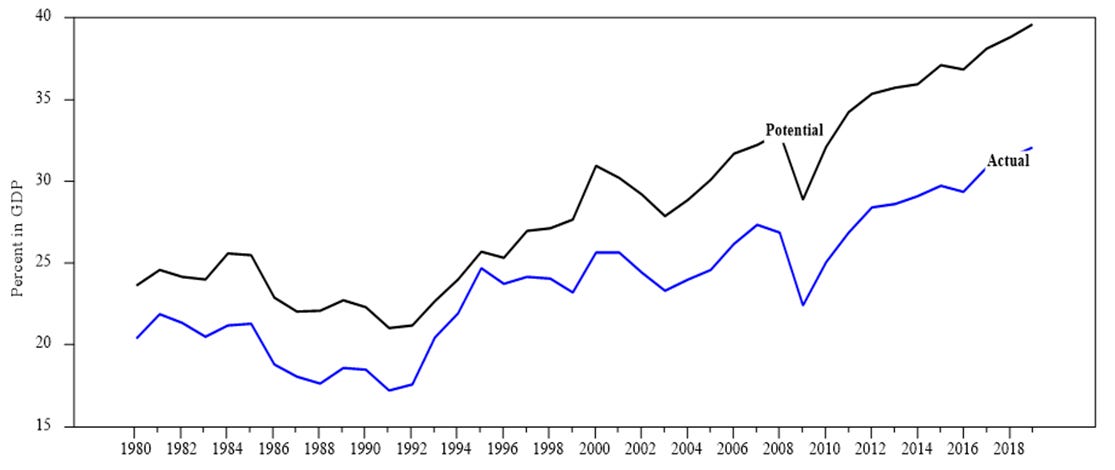
Source: European Commission,DG ECFIN Ameco database. https://ec.europa.eu/info/business-economy-euro/indicators-statistics/economic-databases/macro-economic-database-ameco/ameco-database_en
If not the Euro, then what explains the meagre developments above? And are there other indicators that something is not quite right with the Italian economy? Judging by the developments of unit labour costs (ULC), there is something very wrong with the functioning of the labour market. ULC measure the average cost of labour per unit of output. ULC are calculated as total labour costs relative to total output. If ULC keep increasing over time, labour is rewarded in excess of its productivity which is problematic. As you may have noted from the above, I find talk about competitiveness for countries problematic but a development like the Italian indicates that something is wrong, c.f. Figure 2.
Figure 2. Unit labour costs relative EA12.

Source: European Commission,DG ECFIN Ameco database. https://ec.europa.eu/info/business-economy-euro/indicators-statistics/economic-databases/macro-economic-database-ameco/ameco-database_en Note: The series is shown as logs of an index, which equals 1.0 at 1980 so starts at zero. ULC for Italy is calculated relative ULC EA12. Since the vertical axis is in log units, the slopes of the series are the rates of growth. An increase of 0.5 is a growth of 100*(exp(0.5)-1) relative the growth of EA12 ULC.
Like other firms, Italian firms compete also with the qualities of their goods. Researchers at Harvard’s Growth Lab have come up with clever methods to assess the countries’ technological capacity or ability to produce complex high technological products for exports. The countries are ranked the Economic Complexity Index (ECI). According to the ECI, Italy was exporting the fifth most complex goods in 1980. By 2017, quite a few countries are more able, than Italy, to produce complex goods. Italy shows the largest deterioration of the countries since 1980 of the highest ranked countries in 1980, c.f. Figure 3.
Figure 3. Economic complexity country rankings 1980 and 2017.

Source: https://atlas.cid.harvard.edu/
The graph above implies that Italy’s industry’s capacity to innovate has not been able to keep up with many other countries. Weak innovation is often associated with low total factor productivity growth which in turn could lead to low growth of GDP per employed (and GDP per capita).
And that seems to be the case. Italian labour productivity and TFP have declined relative EA12 since 1980. The developments looked quite good a few years after the introduction of the euro but that was only temporary, c.f. Figure 4.
Figure 4. GDP per employed and TFP relative EA12

Source: European Commission,DG ECFIN Ameco database. https://ec.europa.eu/info/business-economy-euro/indicators-statistics/economic-databases/macro-economic-database-ameco/ameco-database_en Note: The series are shown as logs of an index, which equals 1.0 at 1980 so it starts at zero. GDP per employed and TFP for Italy are calculated relative the equivalent series for EA12. Since the vertical axis is in log units, the slopes of the series are the rates of growth. An decrease of 0.1 is a change of 100*(exp(-0.1)-1), i.e. around -10% relative the growth of EA12 GDP per employed or TFP.
The euro has had nothing to do with Italy’s problems. The problems are structural. An economy that is specialised in low or medium-low knowledge industries, a relatively low share of tertiary educated labour force, a large share of small firms with low productivity growth, weak competition and more heavily regulated than most other EU economies, explain why labour productivity growth has consistently been among the lowest in the EU since 1970. For more evidence and arguments in this direction, see here, here, here, and here