


Wage and capital shares in Sweden.

Spoiler: Measuring income equality in the classical way where a nation’s income is distributed between capital and labour, shows that the wage share in Sweden has increased since 1993. In order to properly measure how the capital share has developed, one must take the depreciation of the capital stock into account.
This adjustment shows that the capital income share of factual income (wage compensation + gross capital income – depreciation) decreased from 34% in 1993 to 22% in 2018.
Claims of increased inequality in Sweden regularly find their ways into media. Especially now after the publication of the report by the Jämställdhetskommissionen. Discussions of income inequality are often confusing since different measures on income are used. The use of definition is often dependent of which development one wants to emphasise. Look in the box at the end of this post for different definitions of income and the development of income inequality in Sweden 2000-2017.
A classic way to analyse income inequality is to study the developments of wage and capital shares of a country’s total income. That provides a view of the distribution of income between capital and labour. As I showed here, , real labour income, productivity and the labour share have increased in Sweden since 2000.
In this post I will look back a bit longer and a year further. To be precise from 1993 and to 2018 with data from Statistics Sweden. The concept of Sweden’s national income that is used below is GDP at factor costs. The wage share has increased from 48% in 1993 to 55% in 2018. The obvious conclusion would be that the capital share has decreased from 52% to 45% during the same period of time. However, this does not take into account that part of the capital share is merely a compensation to replace depreciated capital, not income that can be used to consume, invest or save. The actual income that accrues to capital owners is the net capital share. The net capital share is what is left after replacement of the depreciated capital stock. It is a what is actually paid to capital owners in terms of profits and dividends. That has decreased from 34% in 1993 to 22% in 2018, c.f. Figure 1.
Figure 1. Wages, net profits and depreciation of the capital stock as shares in GDP 1993-2018.
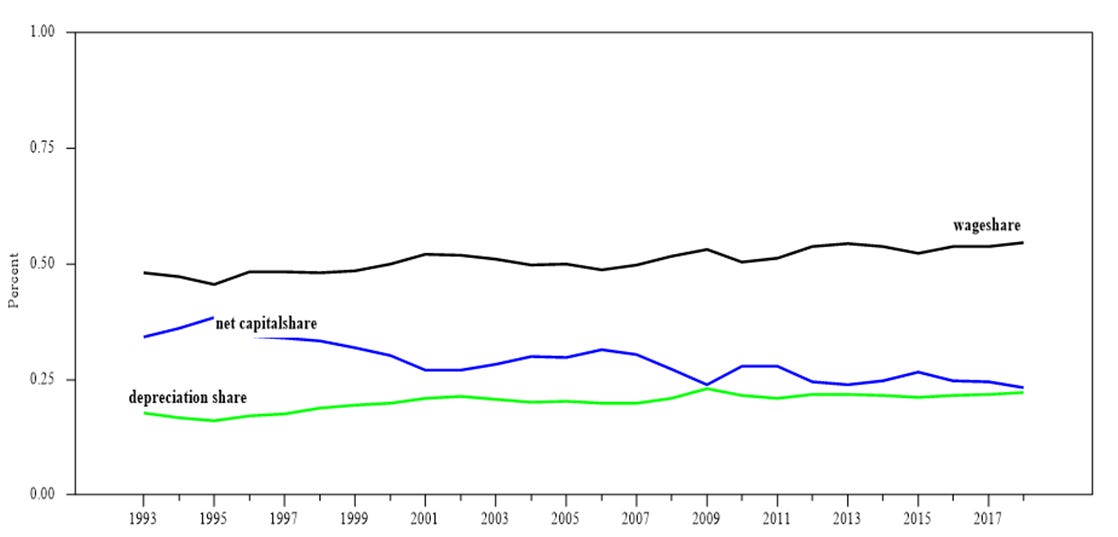
Source: Statistics Sweden. https://www.statistikdatabasen.scb.se/pxweb/en/ssd/START__NR__NR0103__NR0103E/NR0103ENS2010T08NA/ Note: Capital and wage shares are adjusted for imputed compensation of self-employed.
The increasing share of depreciation in factor costs mean that more and more of the gross capital share is used to replace and maintain the capital stock. In 1993, 34% of gross profits (gross operating surplus) was used to compensate for depreciation of the capital stock. In 2018, half of gross profits was devoted for this purpose, an increase of 43%, c.f. Figure 2.
Figure 2. Depreciation as percent in gross profits 1993-2018.
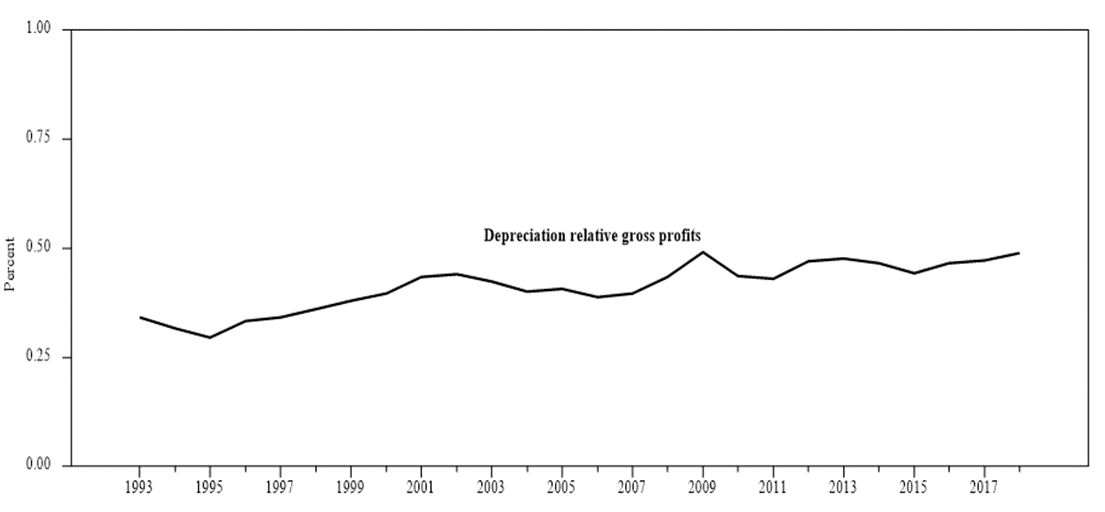
Source: Statistics Sweden. https://www.statistikdatabasen.scb.se/pxweb/en/ssd/START__NR__NR0103__NR0103E/NR0103ENS2010T08NA/
In order to know how large a share capital income is truly income, one needs to subtract depreciation from GDP at factor costs. This adjustment shows that the capital income share has decreased from 41% in 1993 to 30% in 2018 while the wage share has increased from 59% to 70% during the same period of time, c.f. Figure 3.
Figure 3. Wage and capital incomes as shares in GDP at factor costs minus depreciation 1993-2018.
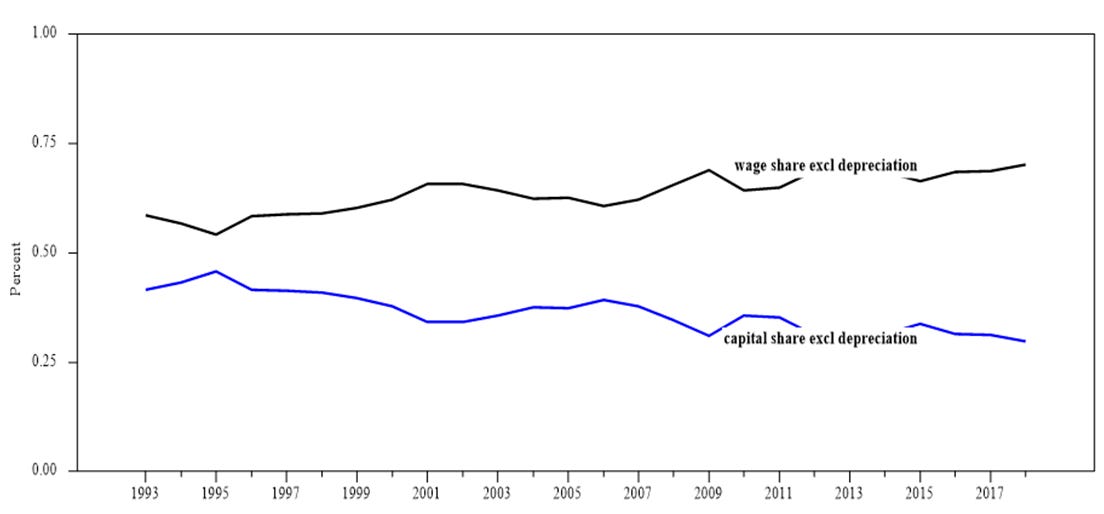
Source: Statistics Sweden. https://www.statistikdatabasen.scb.se/pxweb/en/ssd/START__NR__NR0103__NR0103E/NR0103ENS2010T08NA/
While the capital share net of depreciation has fallen, the wage share in Sweden increased between 1993 and 2018. The use of wage and capital shares as measures of income inequality are however not without problems. They do not take distributions of income within wage earners and capital owners into account. Nor do they take into account that many wage earners and capital owners receive both types of incomes. But that is (maybe) a subject for a future post.