

Update. Has increasing income inequality in Sweden become a big problem?
Update. Has increasing income inequality in Sweden become a big problem?
This post is an update of a post from 2019. The answer to the question above was no at that thime. Has it changed?

Spoiler: The Covid crisis is believed to have led to increased income inequality. In the debate some people argue that it has increased dramatically and much more than in most other countries. The last time I blogged about income inequality in Sweden, I concluded that it was not a big problem.
My 2019 post covered developments until 2017. Income inequality has increased slightly since then. The income share of the households with the top ten percent incomes has increased. The shares for the other income deciles have decreased. With one exception. The share for the first decile, households with the bottom ten percent incomes has remained constant. Their incomes actually increased in monetary terms during the Covid pandemic. This shows that the welfare state can perform its core task, protecting the people with the lowest incomes.
My conclusion has not changed. Income inequality in Sweden is not a big problem.
In my previous post about income inequality in Sweden,
Increasing income inequality in Sweden is not a (big) problem.

Absolute and relative concepts of income
I found that it was not a big problem. Income inequality had increased slightly. Is it still a small problem or has it increased much? From time to time, voices are raised by people arguing that inequality in Sweden has increased much more than in other countries and that the income gaps have widened dramatically and that the number of poor households have increased significantly. Both these statements, from Statistics Sweden, referred to increases in relative terms. Looking at absolute numbers showed increasing incomes and less poverty across the board. Below is a graph showing some developments which can be interpreted differently.
Both indicators in the graph show developments for households’ equivalised disposable incomes excluding capital gains in 2022 prices. The line showing low economic standards show the percent of households with an income below 60 percent of the median disposable income. The graph shows that since 2017, income inequality as measured by the GINI coefficient has increased slightly, from 0.28 to 0.29 while the share of households with low economic standard has decreased during the same period of time.
GINI coefficient and low economic standard in Sweden.

Source: Statistics Sweden
I am not a fan of indicators like the one above allegedly showing low income standards. Here is my problem with the indicator. Even if incomes of households with low income standards increase, the share of such households will increase if their incomes increase less than incomes with median or higher incomes.
The above graph can also be used to show how the choice of time periods can give rise to different conclusions. In one of the links above the graph, it was stated that the number of poor households had increased. But that was valid in 2019. Since then the share mentioned in the text and the graph has decreased by one percentage point. Different starting points and choices of base years for indices can also be misleading.
Discussion of income inequality are often confusing since different measurements of income are used. Here is a box I made for my 2019 post about income inequality.
Different measurements of income.

There is one income concept missing in the box. If you add the disposable incomes of all members in a household and divide by the number of consumption units in the household, you get equivivalised disposable incomes.
Unless explicitly stated, I will discuss different measures of income excluding capital gains. The reason for excluding capital gains is provided in the box above. Also, analyses on income distribution by the Ministry of Finance suggests that capital gains have no permanent effects on income inequality.
To begin with, let us have a look at an income that is only a subset of disposable incomes, wages. Wage dispersion has increased since my previous post. The P90/P10 ratio has increased from 2.12 to 2.20. The ratio of 2.2 can be interpreted as some in the the P90 decile earns a wage 2.2 times as much as someone in the first, P10, decile. Similarly, the P90/P50 and P50/P10 has increased by 1.3 and 3 percent respectively. This is not much and in an international perspective are these ratios very low.
Wage dispersion has increased

Source: Ekonomifakta
And as Angelov and Waldenström showed here, wage incomes have decreased more for households with lower incomes since 2017. The Covid crisis played a big part of that as these households to a higher extent are or were employed in contact- and labour-intensive sectors that were harder hit by lower demand during the pandemic.
Capital incomes continue to increase more than other sources of income.
Adding entrepreneurial and capital income to wages, the income concept of factor income shows that capital incomes shares of factor income excluding capital gains have increased since 2017. The capital income shares increased by 12.4% between 2017 and 2022. That seems like a lot, but as the graph shows, the capital income share in total factor income is still only around ten percent. The increase in absolute terms only amounted to 1.1 percentage points.
Income shares in factor income excl capital gains.
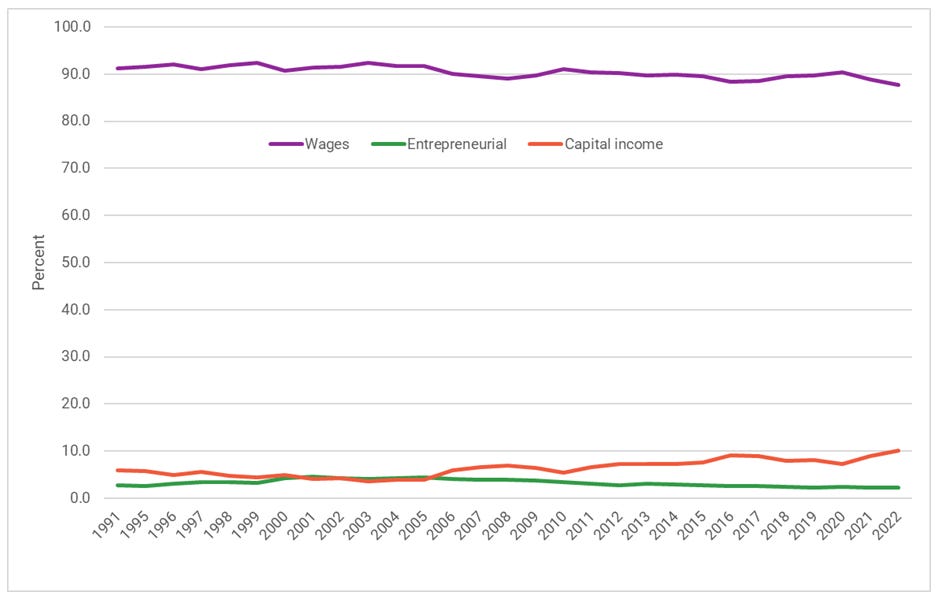
Source: Statistics Sweden. Note: Wages = wages + entrepreneurial income.
Further widening the income concept by adding transfers such as pensions, sickness compensations, labour market assistance, child, study, and housing allowances, and more yields gross income excluding capital gains. In my previous post, one could see that the share of transfers in total gross income had fallen. As we can see below, it has continued to decrease. It has decreased by three percent or 0.8 percentage point since 2017. The increase of capital incomes in gross income is of course smaller, 7.4 percent. It has increased by 13.6 percent or one percentage point since 2017. The share of wages and entrepreneurial income in gross income has remained constant.
Income shares in gross income excl capital gains.
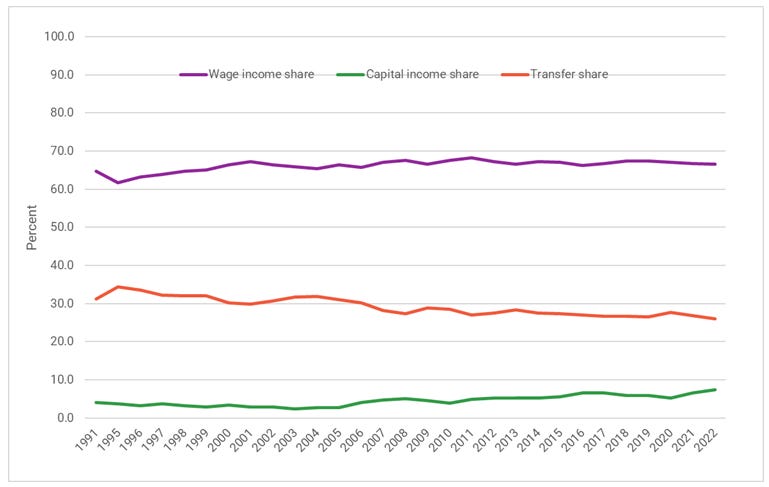
Source: Statistics Sweden
Increasing shares of capital incomes in total income of different kinds imply that households with higher incomes have increased their shares of total income. Looking at deciles of percentiles of total incomes is common in analyses of inequality.
The shares of top income households have increased while bottom income households have remained constant.
Since capital incomes have increased more than other sources of income, one would expect also income inequality to increase. So it has. The share of the top one, five, and ten percent of income households increased by 1.1, 1.0, and 1.2 percentage points respective between 2017 and 2022. Interestingly enough, the share to the bottom ten percent of income households remained constant during the same period of time. This means that the middle-income households’ share decreased.
The shares of top income households have increased slightly since 2017. The bottom 10% income share remains constant.

Source: Statistics Sweden
This is confirmed by comparing the income shares of deciles in 2022 by 2017.
Income shares of deciles (%) in 2017 and 2022. Equivalised disposable income.

Source: Statistics Sweden.
Oops, that was an unnecessarily big table. Anyway, it seems that only the bottom ten percent and the top ten percent gained increases in income high enough for the shares to remain constant and increase respectively. When discussing income inequality, not only the measure is important but also the choice of years between which comparisons are made. Especially when the time period contains developments that may have affected income inequality in the years between 2017 and 2022. Such as the COVID pandemic. Interestingly enough, looking at what happened between 2020 and 2022 the pattern between 2017 and 2022 across income deciles are the same. The share of the bottom decile remains constant and the share of the top decile increases.
The increased share of the top decile may depend on higher capital incomes due to the expansive monetary policy during the pandemic. Unaffected incomes for the bottom decile may be depend on these households receiving a type of income that was not affected by the business cycle. This could be the case if their main source of income was transfers of different kinds.
And this is the case. Different kinds of transfers amounted to almost 52% of the bottom decile’s incomes in 2022. Adding pensions this share of total incomes increases to 75%. That is good news actually. It means that the welfare state works as is should. It protects the incomes for those that need protections.
An increased share for an income decile may be the result the decile’s incomes decreasing less than the incomes for other deciles. Therefore, one should also look at incomes in terms of money, in this case SEK. Doing this shows that the incomes for all deciles increased for everyone between 2017 and 2022. Incomes in the middle deciles experienced lower incomes during the pandemic but the households with the lowest incomes were protected.
Percentage changes of incomes between 2022 and 2017, and between 2022 and 2020.

Source: Statistics Sweden.
Income inequality is still not a (big) problem in Sweden.
Contrary to what is reported in the media every time Statistics Sweden publish another update of its statistics, income inequality is not probematic in Sweden. If it has increased more than in some other countries from one year to another, it is because income inequality is low in Sweden compared to other countries. All these wrong arguments about increased income inequalty have been adressed a number of times by Daniel Waldenström, who happen be one of the most knowledgeful Swedes about the subject, and others. Together with Anders Björklund, he debunks several myths about inequality in Sweden in this working paper.
I haven’t touched about the labour share of income in this post. I may do an update of previous posts about that too.