


The Crumbling States of America

Spoiler: USA has changed from being exceptional in a good way to being exceptional in a bad way. The dynamism of US product markets has decreased. It shows up in lower firm growth, higher concentration and weaker competition. This has led to increased inequality, lower investments, innovation, and productivity growth. At the same time, horrible things are happening with parts of the population. Life expectancy rates are declining because people are dying from suicide and drug abuse. Since this is happening mainly to people with low education and incomes, inequality in health is increasing.
To reverse the developments, the political system needs to be more transparent and less sensitive to rent seeking by large enterprises. But unless the Trumpian tendency to autocracy is reversed, it will be difficult to make the necessary changes.
In a previous post, I briefly mentioned the large income and wealth inequalities in the USA. I will have a closer look at inequality in the USA in this post.
I begin by looking at the same indicators as in the previous post about Swedish real wage and labour productivity growth. The US wage share has been declining since 1970 and has decreased by eight percentage points for the whole period. Contrary to Sweden, the net capital share has not decreased but increased just as much as the depreciation share, c.f. Figure 1.
Figure 1. Wages, net profits, and depreciation of the capital stock as shares in GDP 1960-2019 in the USA.
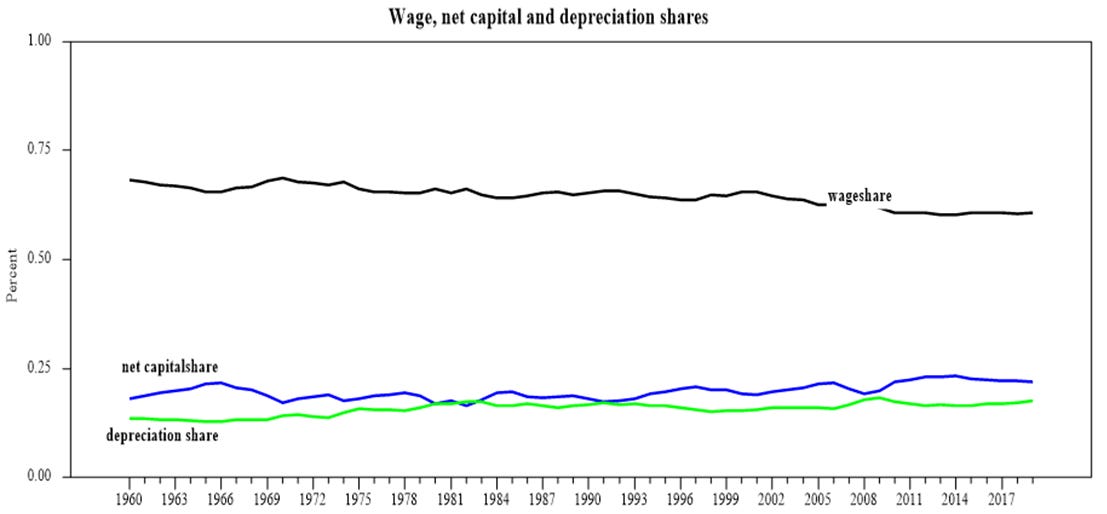
Source: Ameco Database, DG Ecfin, European Commission. Note: Capital and wage shares are adjusted for imputed compensation of self-employed
The rising shares of depreciation and net capital implies that the wage share has taken a hit also of pure factor incomes. To know how large a share capital income is truly income, one needs to subtract depreciation from GDP at factor costs. This adjustment shows that the wage share declined by five percentage points from 79% to 74% while the capital share increased from 21% to 26%. The lion share of the decrease of the wage share in the US, has occurred during the 2000’s as it has fallen by five percentage points between 2000 and 2019. It only fell by two percentage points between 1960 and 2000.
US real wages lag labour productivity
The falling US labour share implies that real wages lag labour productivity growth. Perhaps especially so since the turn of the Millennium. Graphing these variables and indexing them to equal 100 in the year 2000, shows that real wages growth exceeds labour productivity growth in Sweden since 2000 but that the opposite has occurred in the US, c.f. Figure 2.
Figure 2. Real hourly wages and labour productivity 1960-2019 in USA.
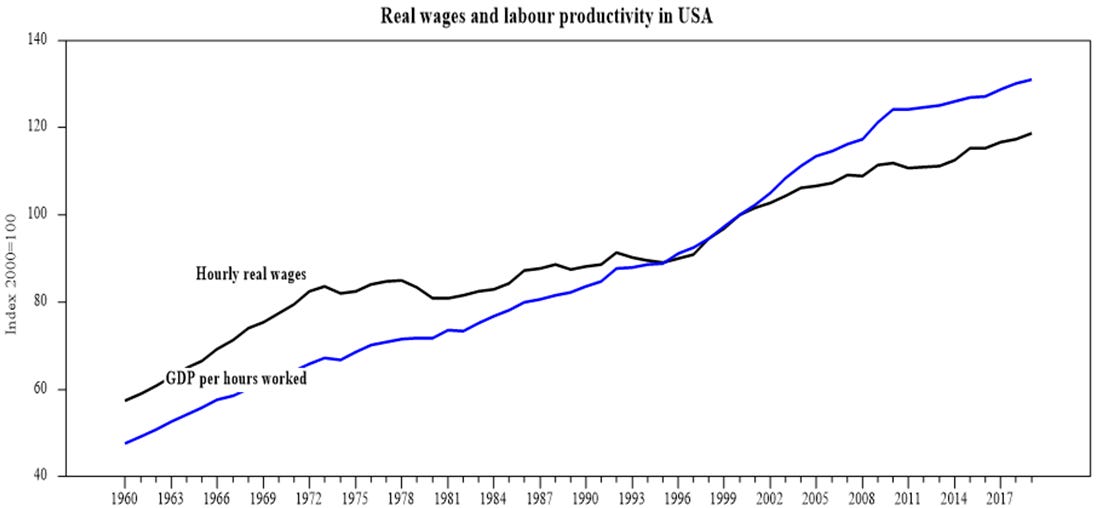
Source: Ameco Database, DG Ecfin, European Commission. Note: Labour productivity is defined as GDP per hours worked.
The divergence of real wage and labour productivity in the US, began already before the year 2000. It did however become larger since year 2000. As I wrote in this post, the labour share and the real wage depends on the degree of competition on the markets. The less competition on markets, the more will firms be able to raise their prices and markups at the expense of real wages and the labour share in total income.
Weaker competition on US markets has led to higher profits, increasing inequality and lower investments…
In his book “The Great Reversal. How America gave up on free markets”, the French economist Thomas Philippon shows that the weakening competition on American markets is mostly explained by higher concentration of American firms which has led to higher profits, higher inequality, lower investments, and growth.
There’s nothing wrong with higher profits if they are used for investments. Unfortunately, net investments relative net profits (net operating surplus) has been decreasing for quite some time, but especially so since the beginning of the Millennium, c.f. Figure 3.
Figure 3. US net investments relative net operating surplus (top) and gross profits as a share in GDP (bottom) 1960-2019.

Source: Net investments relative net operating surplus. Ameco Database, DG Ecfin, European Commission. Gross profits relative GDP. Federal Reserve Economic Data. Note: The data from AMECO shows a higher net investment ratio than the data in Figure 4.1 on page 63 in Philippon (2018). The trends are the same, especially the decelerating development since the year 2000. The data from FRED. Shares of gross domestic income: Corporate profits with inventory valuation and capital consumption adjustments, domestic industries: Profits after tax with inventory valuation and capital consumption adjustments.
Lower investments have been accompanied by an increasing share of profits relative to GDP as the bottom panel above shows. Weaker competition means that firms have less reasons to invest. Therefore, instead of investing in new and improved capital, the profits have, increasingly, been used by firm managers to pay out dividends to shareholders and buy back shares from them. Since the main recipients of those payments earn more than the average or median wage earner inequality increases.
…caused by higher concentration on the markets…
Philippon shows that this development is due to more concentrated American product markets. Concentration can be good and occur due to increased productivity but Philippon shows that concentration in most cases have increased for the wrong reasons. Declining entry and exit rates imply a that the dynamism of the markets is decreasing. When fewer firms than before enter the market, the incumbent firms have less reasons to lower their prices or increase the quality of their goods. Increasing numbers of mergers and acquisitions have added to the concentration. Mergers and acquisitions have not only decreased the number of existing firms on the markets but also the number of future firms as many start-up firms have been acquired before they enter the markets which is also shown by the declining number of firms who issue shares and go public on the stock markets in the USA.
At the same time, exit rates have also decreased. This means that fewer firms have been forced to leave markets due to competition. Decreasing entry and exit rates show that the dynamism of the American markets is declining. Fewer new firms with innovative products enter the markets at the same time as the incumbent firms do not need to invest in new capacity to remain in the markets.
…which have been more difficult to enter due to incumbent firms’ lobbying for barriers to entry.
Increased concentration of markets has been facilitated by policy makers. Increased regulation of entry and changes in tax legislation for existing firms are two types of policies that preserve the prevailing market structures. The first policy makes it more difficult for new firms to enter and the second type of policy makes it easier for incumbent firms to remain on the markets and grow bigger.
Philippon, and the studies by others he refers to, shows the developments above has occurred at the same time as firms’ lobbying efforts have increased significantly in the USA. Most of the lobbying efforts are undertaken by large firms who are eager to protect their positions and create economic rents.
The American health-care industry is a case in point as it shows how lobbying works at the expense of ordinary Americans. Around 80% of Americans live in metro areas with highly concentrated hospitals. This is the result of an industry where there have been around 70 mergers of hospitals during the last decade. Concentration can be good if it is the result of fierce competition pushing costs down. The American healthcare industry is the opposite. It applies not only to hospitals but also to the pharmaceutical industry which charges around three times more for its products than its European counterparts.
The healthcare industry provides the case in point with increasing concentration, increasing costs, yielding inequality in health.
The American healthcare is very regulated, very costly, very inefficient, and very concentrated. This has been documented extensively not least by Case & Deaton in “Deaths of despair and the future of capitalism”. Contrary to other countries, and other groups in the USA, mortality rates of white middle-aged men began to increase during the end of 1990s. During the most recent years, mortality rates of black men have also moved upwards. In both cases, men with relatively low education and lower incomes have been hurt.
Many of these deaths are strongly associated with the opioid crisis. That was, if not created, at least made worse by the industry’s lobbying efforts against limits of prescription of the drugs. The prescription of opioids was one of the failing features of the healthcare system that increased its costs. One way of illustrating the failure of the American healthcare system is to plot healthcare expenditures per capita vs life expectancy across countries, c.f. Figure 4.
Figure 4. Life expectancy vs health expenditures per capita in USA and other countries.
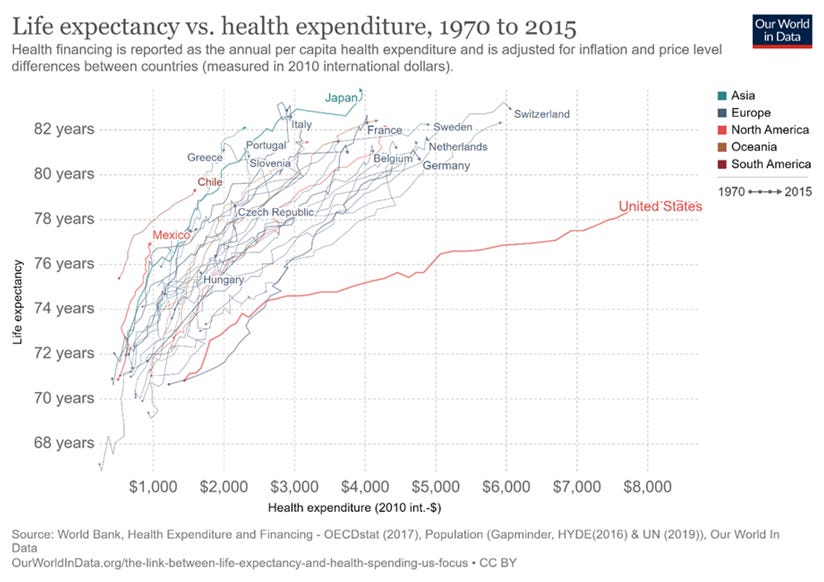
Source: https://ourworldindata.org/the-link-between-life-expectancy-and-health-spending-us-focus
While the expenditures keep increasing, life expectancy in the USA has stopped to increase. It has decreased since 2014. This development is of course a consequence of the rapid increase in deaths in the USA since the beginning of the Millennium which Case & Deaton show in detail. It is tempting to relate this to greater inequality and poverty in the USA or to other economic factors such as the Global Financial Crisis. But this is not the case. Life expectancy has continued to increase in countries that were hit as hard as the USA and whose governments imposed harder austerity measures to reduce budget deficits, c.f. Figure 5.
Figure 5. Life expectancy at birth in USA and five EU countries.
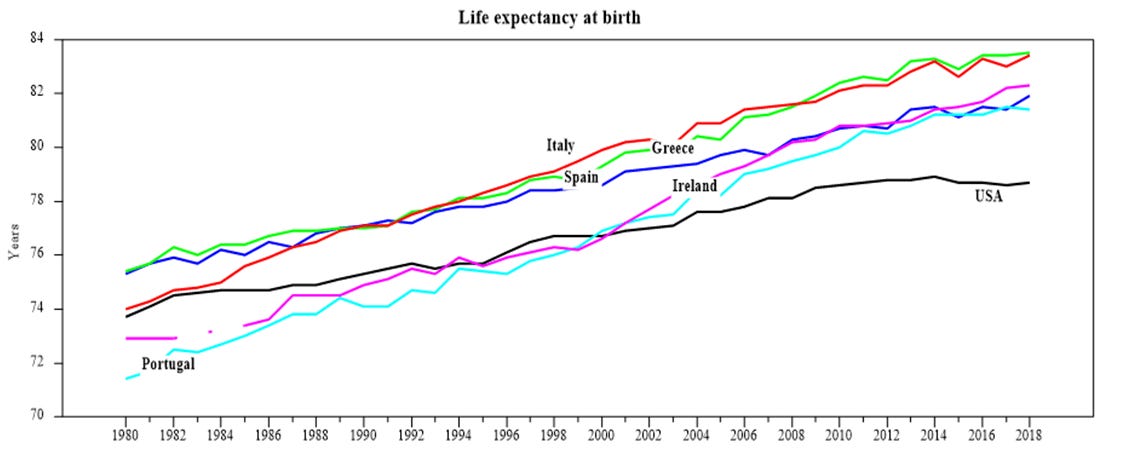
Source: OECD,oecd.stats.org
US healthcare expenditures occupied 17% of GDP in 2019. This is five percentage points more than in Switzerland which is the country which, next to the USA, spends most on healthcare relative GDP in the OECD. The OECD average is 9%. American per capita expenditure in US dollar PPPs, amounted to 11, 000 in 2019 which is about three times more than the OECD average. Again, Switzerland “came in second” with 7, 700 US dollars per capita.
The costs of the healthcare system increase inequality directly by holding down wages and indirectly by making the federal and state governments collect more taxes and provide less of everything else such as infrastructure, education and other types of expenditures that benefit people in the lower income brackets more. See USA Facts for more information on healthcare in the USA.
Autocracy and corruption on the rise during Trump’s presidency,
The developments sketched above show that there is something wrong with the American system. Political decisions have been made that protect incumbent firms from competition and benefit the upper income brackets. Tax reductions that favour the rich and trade wars that allow American firms to raise prices of their products at the expense of American households, are just two examples of how Trump makes things worse. It is not surprising that the industries’ lobbying efforts have increased during his presidency. This is what to be expected when a country backslides into autocracy. Not only has the administration become more corrupt, but it also shows no respect for the constitution, c.f. Figure 6.
Figure 6. Corruption of members of the executive (top) and executive members’ respect of the constitution (bottom).

Source: V-Dem Institute. Varieties of Democracy database. https://www.v-dem.net/en/. Note: Corruption among the executive measures how routinely members of the executive, or their agents, grant favours in exchange for bribes, kickbacks, or other material inducements. The indicator ranges from 0 (it is routine and expected) to 4 (never or hardly ever) Executive members’ respect of the constitution indicates whether members of the executive respect the constitution. The indicator ranges from 0 (the executives violate the constitution whenever they want to, without legal consequences) to 4 (never or hardly ever).
Trump has used the presidency for his own gain and managed to make the administration more corrupt. His attacks on American political institutions bare evidence of his preference for an authoritarian system. It is therefore not surprising that political scientists and other experts on American democracy are considering that democracy in the USA is on the retreat, c.f. Figure 7.
Figure 7. Liberal democracy in the USA.

Source: V-Dem Institute. Varieties of Democracy database. https://www.v-dem.net/en/. Note: Liberal democracy index. The liberal democracy index assesses the quality of democracy by the limits placed on government. This is achieved by constitutionally protected civil liberties, strong rule of law, an independent judiciary, and effective checks and balances that, together, limit the exercise of executive power. To make this a measure of liberal democracy, the index also takes the level of electoral democracy into account.
Read more:
Bright Line Watch: https://brightlinewatch.org/
Anne Case & Angus Deaton, (2020). “Deaths of Despair and the Future of Capitalism”. Princeton University Press.
Thomas Philippon, (2019). “The Great Reversal. How America gave up on free Markets”. Belknap, Harvard.
USA FACTS: https://usafacts.org/
Varieties of Democracy: https://www.v-dem.net/en/