

Swedish industries between the Corona crisis and Putin’s war against Ukraine.
Swedish industries between the Corona crisis and Putin’s war against Ukraine.

Spoiler: Swedish industries recovered from the Corona crisis. In December 2022, two thirds of the industries had higher levels of production than 12 months earlier. At this point in time, the increase in energy prices had lasted for a few months. The impact on firms and industries varies depending on energy intensity and duration of contracts between firms and their energy suppliers.
The Diffusion Index contains data for all industries until December 2021. There is data for thirty-four industries until February 2022. The developments of those industries suggest that the Index continues to grow until February.
The psychopath in Kremlin’s war against Ukraine is not yet visible in the data. How this will affect Swedish industries remain to be seen. It has resulted in disrupted supply chains, and higher energy costs increasing the prices of other inputs and the general inflation rate. Whether this supply chock will translate into a recession remains to be seen.
This is an update the post below.

which itself was updating previous posts on the same subject. Since the last post, Swedish GDP has increased and is above its pre-Corona level. GDP increased by 1.4%, on an annual basis, in the last quarter of 2021 compared to the last quarter of 2020, c.f. Figure 1.
Figure 1. GDP in Sweden 2019:4-2021:4, index 2019:4 = 1.

As in previous posts a Diffusion Index shows the overall situation for aggregates of individual industries. The index is calculated for forty-six different industries and shows the difference between the percentage of industries that are growing and the percentage of industries that are declining. Growing means that an industry’s production value index is increasing compared to 12 months earlier. Declining the opposite.
The graph below shows developments between January 2011 and December 2022. Following the outbreak of Covid-19, the diffusion index declines sharply and reaches minus sixty-one in April 2020. That low is then the benchmark for the high values a year later in April and May 2021. The maximum of seventy-eight was reached in May 2022. The following months witnessed a return to less extreme values. The index increased again during the last two months of 2021, c.f. Figure 2.
Figure 2. Diffusion index for Swedish industries, 2011:1-2021:12.
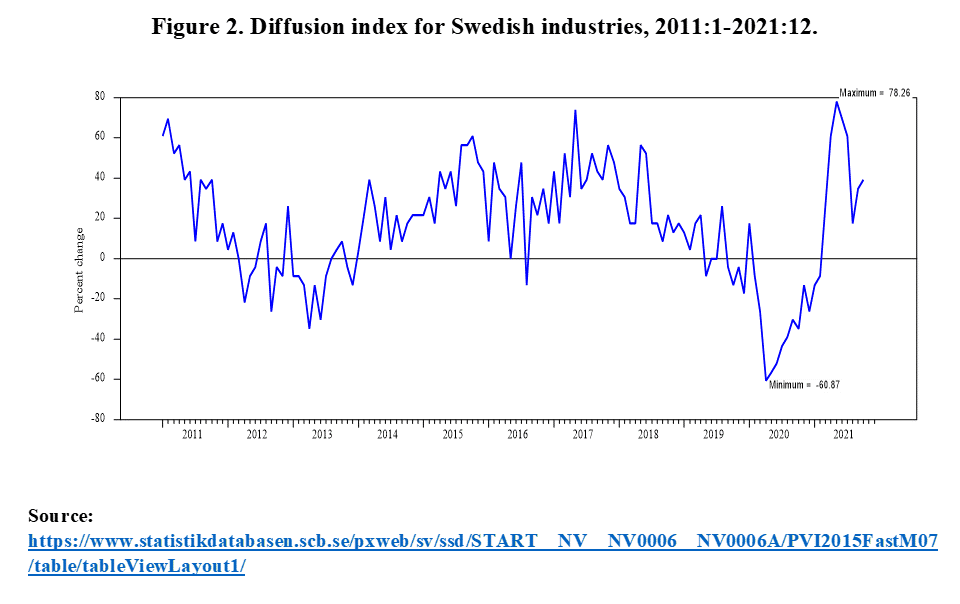
Data for all industries is only available to December 2022. There is however data for 34 of the 46 industries until February 2022. Calculating the Index for these yields sixty-four indicating an increasing activity. Most of the industries for which data ends in December are growing which indicates that the overall Diffusion index will increase until February 2022.
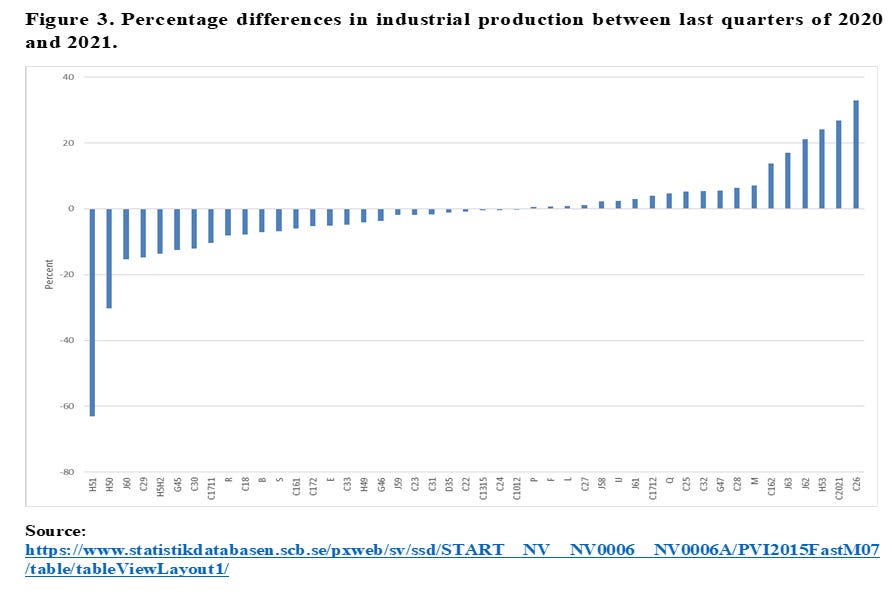
Looking at changes in industrial production between the last quarters of 2020 and 2021, shows, as in previous posts, that Transportation Services Industries suffered most. Information Services, Computer & Electronics Manufacturing Industries, Postal and Courier Services together with Chemical industries keep growing, c.f. Figure 3.
Figure 3. Percentage differences in industrial production between last quarters of 2020 and 2021.
It remains to be seen how Putin’s war against Ukraine will affect us. Future posts on this theme will take a closer look at employment developments across industries. A brief look shows that total employment is higher now than in the fourth quarter of 2019. There is a lot of variation across industries behind this aggregate. Employment in Hotels & Restaurants is 10 percent below the pre-corona level while the opposite is true for Information Services.