


Reducing working hours when productivity declines is perhaps not a good idea.
Hours worked per employee matters more when producitivity growth is low.

Spoiler: The Swedish Labour party wants to reduce working hours from 40 hours per week to 35 hours per week. The proposal is heatly debated in the press. Those in favour argue that the reduction not only improve health of employees but also increase productivity growth. At least the latter argument appears loosely based on empirical evidence, to put it mildly. Labour productivity growth was very high during the 1970s when working hours per week were reduced from 48 to 40, and a fifth week of vacation was introduced. Changes in regulations of sick leave, and other matters have reduced the working week further. After taking into account these absences from the working place for different reasons, the average number of worked hours per week is 32.
Those regulations have not been accompanied by incresing labour productivity growth. On the contrary, it has slowed down. As labour productivity growth has slowed down, its contribution to GDP per capita growth has declined at the expense of other factors such as the labour force participation rate. The contributions from the working age population rate, and hours worked per employee are negative. Further reductions of working hours would further reduce the growth rate of GDP per capita.
A reduction in working hours will, unless other factors counteract it, lead to a reduction in growth of GDP per capita. To show this I will, as in some previous posts, like this,

decompose GDP per capita in the following way.
That makes changes in GDP per capita the sum of changes in GDP per hours worked, hours worked per employee, employment relative to the working age population, and finally the share of working age population in the total population. The working age population is defined as people in the ages 15-64 years of age.
I will, as in previous posts, below look at the changes of these variables in terms of average annual ten-year growth rates. The growth rate of GDP per capita as slowed down siince the Millennium even though it increased temporarily in the beginning. Closely related to it, is the growth rate of labour productivity, GDP per hours worked. The developments of the three other components are more stable but their importance grows over time as labour productivity growth declines. Especially, the growth of the employment rate’s contribution to GDP per capita growth has increased after the turn of the Millennium. The contribution of hours worked per employee (HL), and the working age population rate are close to zero or negative
Actual GDP per capita and its components 2000-2022.
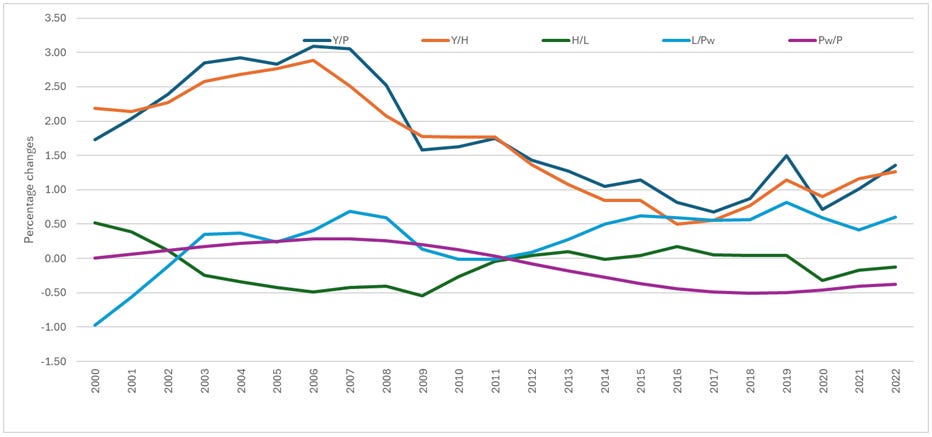
Source: AMECO database, European Commission.
I have in previous posts been complaining about the declining growth rates over time. The growth rates after the Millennium can be compared to the growth rates for the period 1978-2000 which covers the same number of years. Calculating the difference, in percentage points, of the growth rates, shows that GDP per hours worked and hours worked per employee acounted for the largest declines. Note that growth hours worked per employee has been negative after the Millennium. Hours worked per employee have decreased by on average 0.2 percent per year after the Millennium. The increase of the employment rate after the Millennium counteracted the declining growth rates of GDP per hours worked and hours worked per employee while the ageing population has had a negative influence.
GDP per capita developments before and after the turn of the Millennium, and the difference, in percentage points, between them.

Source: AMECO database, European Commission.
What if? Looking back.
What would GDP per capita growth 2000-2022 looked like if developments of labour productivity, hours worked per employee, the labour force participation rate, and working age population rate had been the same as 1978-2000? Let us have a look. The blue line shows the actual annual average 10-year growth rates of GDP per capita (Y/P) between 2000 and 2022.
The most striking change compared to the actual development is the green line showin the developments of GDP per capita 2000-2000 if the hours worked per employee (H/L) had grown at the same rate as between 1978-2000. After 2010, only the 1978-2000 growth rates of the employment rate (L/Pw) has resulted in a lower growth rate of GDP per capita.
Hypothetical GDP per capita and its components 2000-2000.
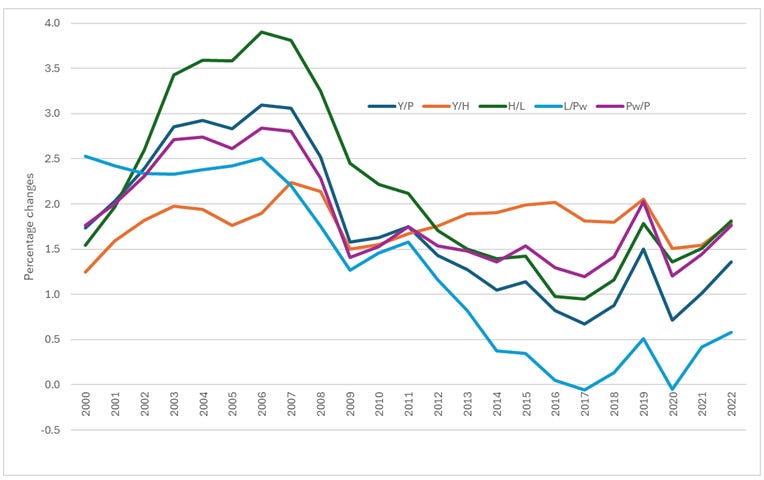
Source: AMECO database, European Commission.
Summarising the developments in the graph above and calculating the difference to the actual change yields the following table. Annual GDP per capita growth between 2000 and 2000 had been 0.77 percent higher if hours worked had increased instead of decreased.
Hypothetical GDP per capita developments 2000-2000, and diffences to actual GDP per capita in percentage points.
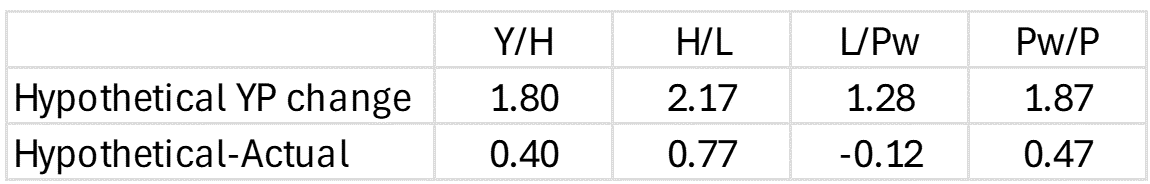
Source: AMECO database, European Commission.
What if? Looking forward.
I know by experience that one should not make forecasts. Especially not of variables whose developments affect each other like those above. As I have rambled in previous posts, increased prosperity has led us to work less, and have fewer children. Anyway, this is not a peer-reviewed article, this is a blog by a rambling man. So, what comes next should be taken by ton of salt. I am going to guess the developments for the future 22-year time period 2024-2046.
The question I’m asking is how high needs annual labour productivity growth need to be if we want annual GDP per capita growth to amount to remain at 1.4 percent per year? That depends on the other compontents above. I need to make guesses of their developments. According to Statistics Sweden’s population projections, the working age population rate between 2024 to 2046 will decline by 0.16 percent per year.
Swedish working-age population rate 2024-2046.

Source: Statistics Sweden
Moving on to the other components, the employment rate in 2022 was historically high, 80 percent. I’ll use that number which means that I will assume that the employment rate on average won’t change for 22 years. Then, if hours per employed continue to decline on average by 0.21 percent, GDP per hours worked will have to grow by 1.77 percent per year.
Warranted growth rates of labor productivity, and other components for a 1.4 annual percent growth rate of GDP per capita.

A growth rate of 1.77 percent per year is not unrealistic. In fact, it labour productivity grew by that amount the first ten years of the Millennium. However, a larger reduction in working hours requires a higher labour productivity growth. The Labour party’s demand for a reduction to 35 hours per week implies an actual reduction of some 10 percent of hours worked per employee.
Implementing the change from one year to another would significantly reduce GDP per capita since there is no way that firms can adjust in such a short time to increase their productivity. If the reform was to be implemented over 22 years as above, labour productivity growth would need to be 2.03 percent on average for a GDP per capita growth of 1.4 percent.
The above calculations are of course very rough but they are qualitative correct. You can’t reduce working hours dramatically when labour productivity growth is declining.
How many hours per week do Swedish employees actually work?
Implementing the Labour Party’s proposal of changing the Working Hours Act to reduce the maximum number of hours per week from 40 to 35, is like kicking in an open door. The average number of working hours per week in 2023 amounted to 32 hours. But politicians are gonna politicise…