


Real hourly wages and labour productivity in Sweden.
No decoupling in Sweden.

Spoiler: There has been no decoupling of real wages from labour producitivity in Sweden. At least not on aggregate levels. For the whole economy, hourly real wages growth has tracked labour productivity growth. That applies to the private sector as well. Labor productivity growth has been slightly higher than hourly wages growth in goods producing industries while the opposite applies in services producing industries.
The issue of decoupling of real wages from productivity has been much debated. Hourly real wages seem to have grown slower than labour productivity in USA and other countries as shown in this OECD study from 2017 and also in this study of 22 countries between 1970 to 2018. The study also contains a discussion of factors causing decoupling from technical progress, globalisation, market structure and more.
Most analyses of decoupling use median wages. I do not have access to median wages so I use average hourly real wages. Wages include compensation in terms of social constributions and are deflated by industries’ basic price deflator. The industry specific deflators are preferred before the consumer price index since the former are more likely to reflect marginal revenue product of labour, i.e. the marginal product of labor multiplied by the price of the firm’s product.
In the previous post Wage shares in Swedish industries, I showed that real hourly wages for an industry can be expressed as

where the first term on the right hand side is the labour share relative to a term indicating firms’ markups under imperfect competition. If a market becomes less competitive, real hourly wages suffer and will increase less than labour productivity growth (Y/H) even though the wage share remains unchanged.
No decoupling on aggregate levels.
For the whole economy, including the public sector, real hourly wages and labour productivity closely follow each other.
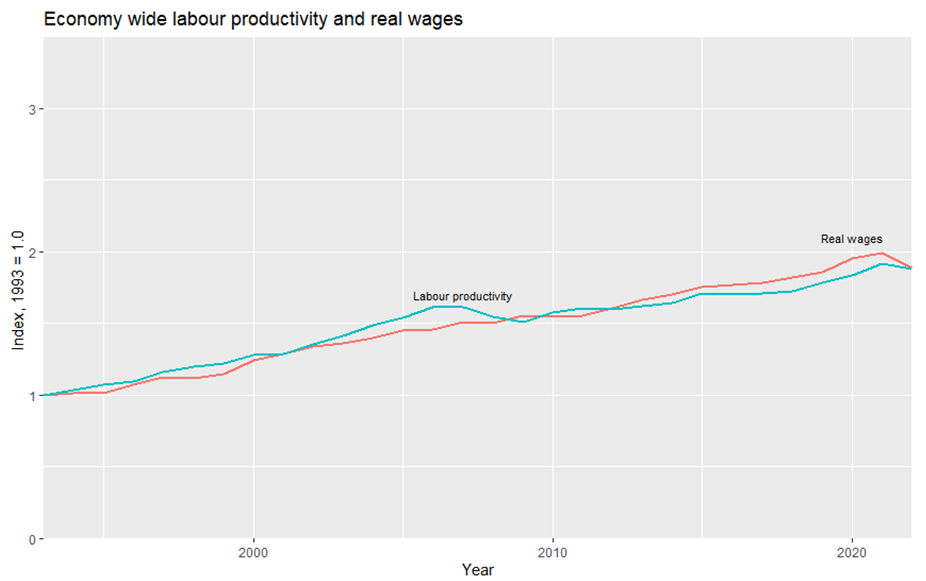
Source: Statistics Sweden.
The expression for hourly real wages is derived from a profit maximisation problem and perhaps not relevant for the public sector. Excluding it and focusing on mostly private firms does however not change the picture significantly. The two variables track each other closely.

Source: Statistics Sweden. Note: Mostly private firms since many firms in the utility industries are owned by municipalities and other public sector entities. There are publicly owned firms also in some other industries.
Splitting the private sector into goods producing industries and services industries provides some nuance. Labour productivity growh slightly is higher than hourly real wages growth in goods producing industries.
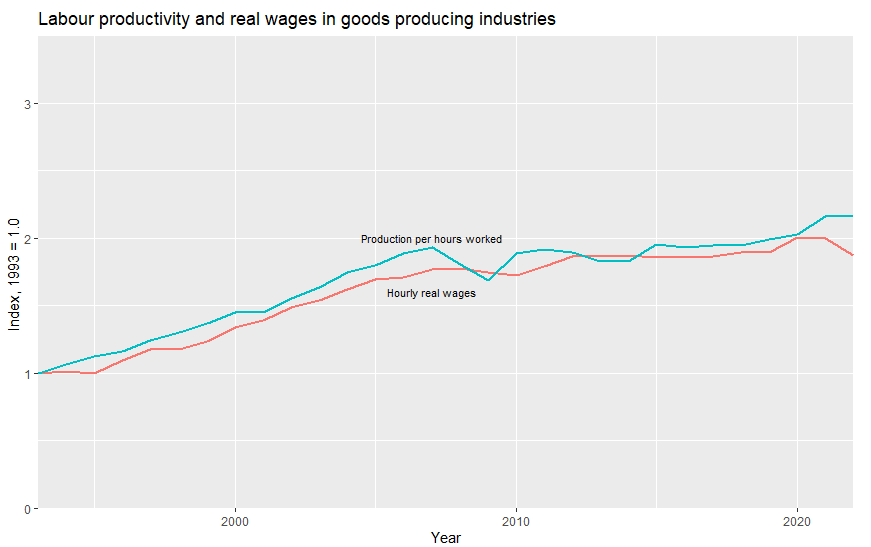
Source: Statistics Sweden.
Goods producing industries is a large aggregate consisting of many industries including agriculture, forestry and fishing, as well as mining industries, manufacturing, utility and constuction industries. But any decoupling tendencies within these industries are too small to show up in the aggregate goods industries.
In services producing industries, hourly real wages have grown slightly faster than labour productivity, but there is no “positive” decoupling as in Financial Services which I showed here.

Source: Statistics Sweden.
No decoupling in food producing and selling industries.
Why look into those industries? Because there was a heated debate in Sweden during the Covid crisis that firms producing and selling food were raising prices in excess of increased costs thereby causing Food greedflation in Sweden. If so, that would have been difficult to reconcile with constant wage shares and a close relationship between hourly real wages and labour productivity.
To get a really good picture of this, one would need to analyse developments on firm levels. I do not have access to such detailed data so I have to suffice with industry level data. For manufacturing that means NACE industries C10-C12, i.e. food, beverage and tobacco manufacturing industries and for services NACE G47 which is an aggregate including retail services of not only food but also clothes and prams.
Anyway, the below are two graphs showing wages, net profits and depreciation shares in value added for the two industries and two graphs showing hourly real wages and production per hours worked, i.e. labour productivity.
Income shares in the manufacturing industries are stable for the whole period.
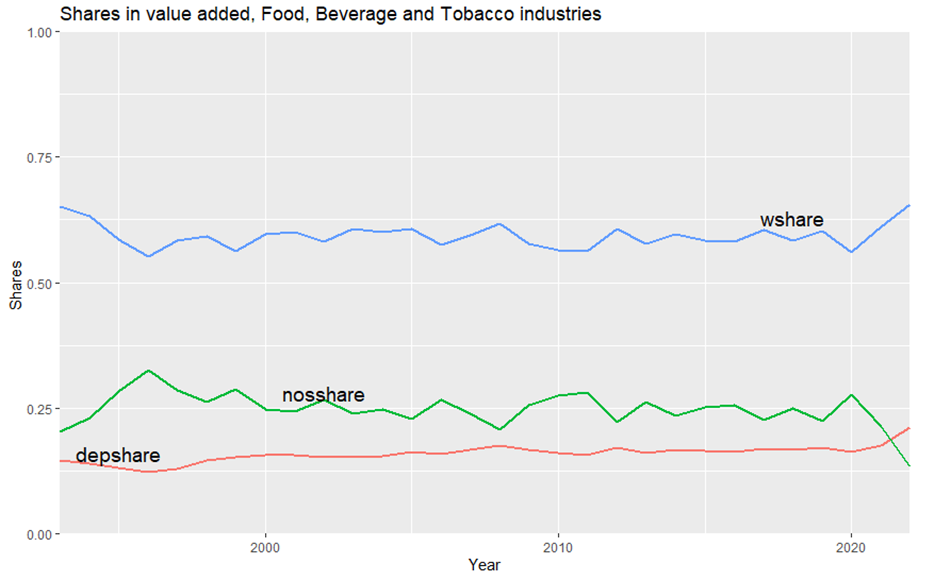
Source: Statistics Sweden. Note: w, gos, nos, and dep denote wage, gross operating surplus (gross profits), net operating surplus (net profits), and depreciation respectively.
During the first years of the time period depicted below, labour productivity growth exceeded growth in hourly real wages. The two series grew together between 1995 and 2020 but in the last three years hourly real wages growth exceeded labour productivity growth.
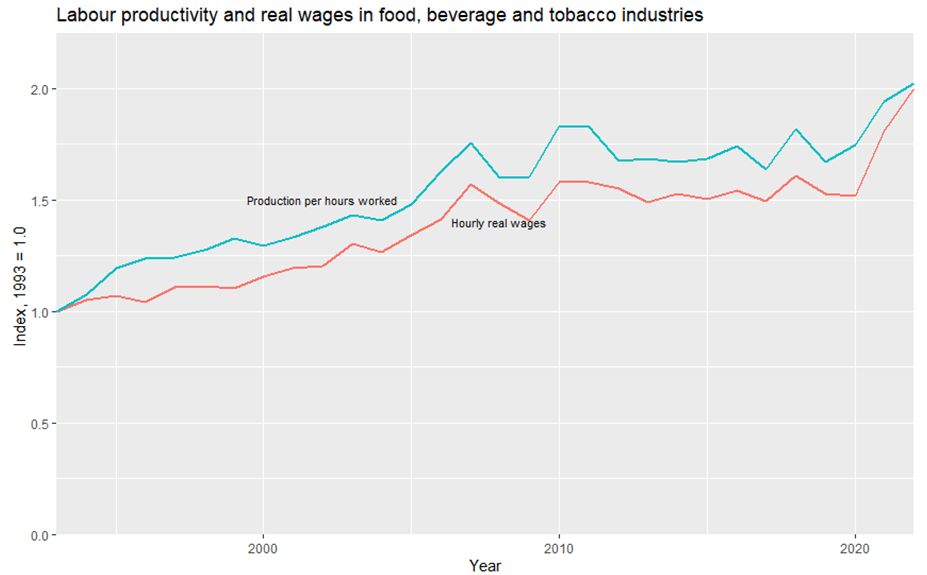
Source: Statistics Sweden.
Labour shares in retail industries are considerably higher and stable over the years.
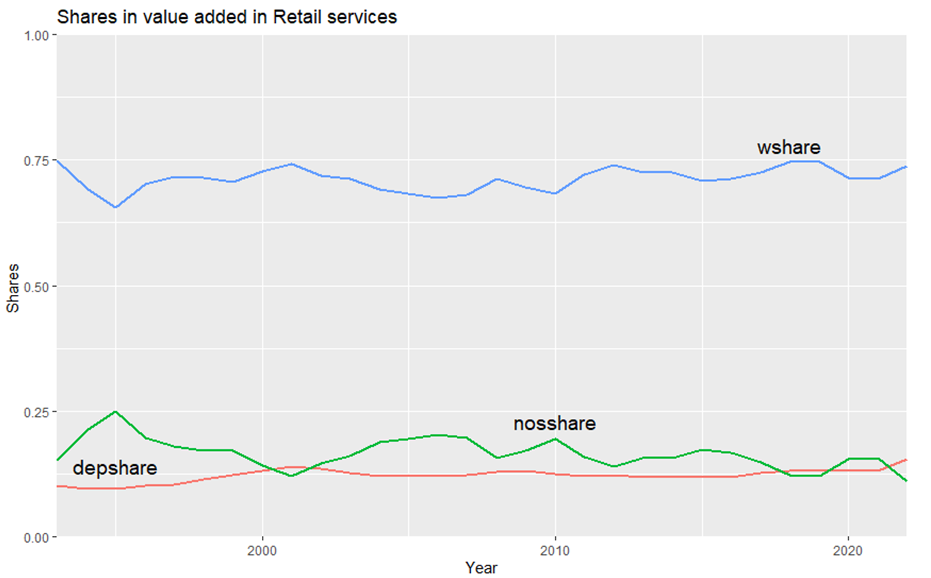
Source: Statistics Sweden. Note: w, gos, nos, and dep denote wage, gross operating surplus (gross profits), net operating surplus (net profits), and depreciation respectively.
Hourly real wages growth has lagged labor productivity growth for a few years but not caused any decoupling of wages from productivity.
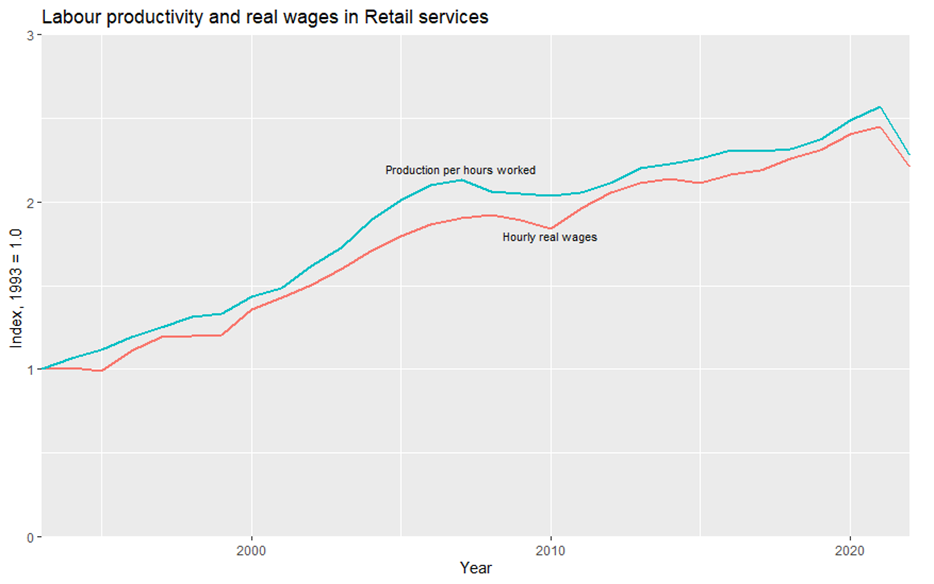
Source: Statistics Sweden.
Some closing remarks.
I could carry on analysing different individual industries but the conclusion would not be different. When I retired I swore a holy oath to myself to never ever fuck around with econometrics. And I am going to stick to that oath. I have come across lots of meaningless econometric analyses of decoupling and shares in GDP. Most of them use methods that are suitable for analysing short-term fluctuations.
But economic theory tells us that the relationships studied in this and previous posts are of a long-term nature which I briefly mentioned in one of my previos posts. My graphs cover 30 years during which the Global Financial Crisis and the Covid crisis account for the lion shares in variations in GDPs and industrial production across countries. The concept of “long-term” does of course not limit itself to a specific number of years. It refers to a situation where markets reach equilibrium levels following changes in demand and or supply that have occurred. Changes such as the Global Financial Crises and the Covid crists and muscovy’s genocidal war against Ukraine.
So, any deviations I may have found above and in previous posts are likely temporary. Why the hell did I write these posts then, you might wonder. Why indeed?