


No Russian gas, wir shaffen das!

Spoiler: Since the psychopath in the Kremlin decided to attack Ukraine on a full scale, the corruption project, aka, Nordstream2 will not be certified by Germany. If I’m correct, Germany has also decided to stop buying Russian gas. The sanctions against Russian will significantly decrease trade with Russia. The Kremlin will probably also implement counter sanctions. To have an idea about the effects of these sanctions, this post will investigate how much Russian exports constitute of total domestic final demand in other countries. The next post will look at it the other way around to give a picture of how Putin has punished his own people.
The Kremlin war against Ukraine has caused many countries and the EU to seriously begin to think of how to reduce their dependence of Russian gas. The dependency is often measured in terms of how much imports of Russian gas or oil constitutes of total energy imports or consumption. That measure is not reflecting the true dependency of Russian gas and other products from Russia. It doesn’t take other suppliers of gas or energy into account. And it doesn’t show how much of the gas that is needed to produce different types of goods and services. A more accurate way to measure the dependence is to look at how much of the total value of final demand in different countries that are generated in Russian gas production. This approach takes into account the total supply of energy and the extent to which energy is used in the production of goods and services that are absorbed domestically in different countries.
This is bad news for Putin who overestimated our dependence on him.
The economic effects of the war against Ukraine are best described as a negative supply chock. Higher prices on oil and gas will be felt for households and firms, c.f. Figure 1.
Figure 1. Prices on oil (left) and gas (right).
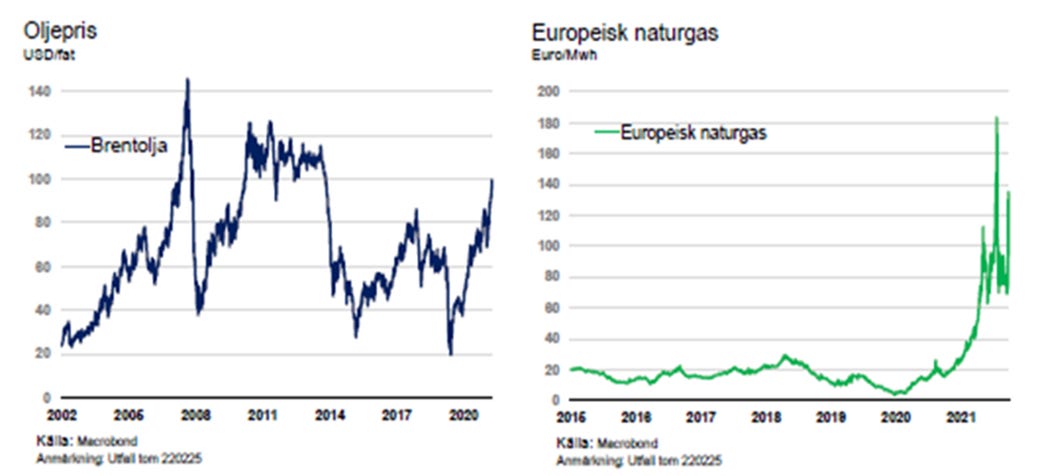
Souce: Macrobond, https://www.macrobond.com/ and press briefing by the Swedish government, 28/2/2022. https://www.regeringen.se/pressmeddelanden/2022/02/potentiella-ekonomiska-konsekvenser-for-sverige-med-anledning-av-rysslands-invasion-av-ukraina/
Some energy-intensive firms may close as they can’t recover their costs at the prevailing prices for their products. Higher prices on energy will also be passed through on all products. The higher prices will reduce real wages and real incomes causing demand to fall. We may find ourselves in a recession thanks to the psychopath in the Kremlin.
Make no mistake, cutting of Russian gas will hurt. Especially in countries where natural gas makes up a high share of total energy consumption, c.f. Figure 2.
Figure 2. EU natural gas consumption as shares in total energy consumption in 2020 (%).

Source: Eurostat, https://ec.europa.eu/eurostat/web/main/data/database and press briefing by the Swedish government, 28/2/2022. https://www.regeringen.se/pressmeddelanden/2022/02/potentiella-ekonomiska-konsekvenser-for-sverige-med-anledning-av-rysslands-invasion-av-ukraina/
But figure 2 above overstates the importance of Russian gas. To get an idea about that you not only need to take other energy suppliers into account but also how Russian energy is used in production of goods for final demand, i.e. private and public consumption+investments.
We are not as dependent on Russia as you might think
Russian exports of goods consist mainly of energy and raw material. Russia exports of manufactured goods is very small. Most Russian goods are found in the upper parts of the value chains. That usually means that they are produced with low technology, and have low value added in comparison to the more sophisticated goods further down the value chains. The further down in the value chain a good is, the more has it been elaborated by R&D, product development, and design. It has also been transformed with the use of specialised material and machinery supplied by industries with a higher technology level. The predominance of raw material and low value-added products in Russian exports reflects the low-technology industry structure, c.f. Figure 3.
Figure 3. Russian exports in 2019.
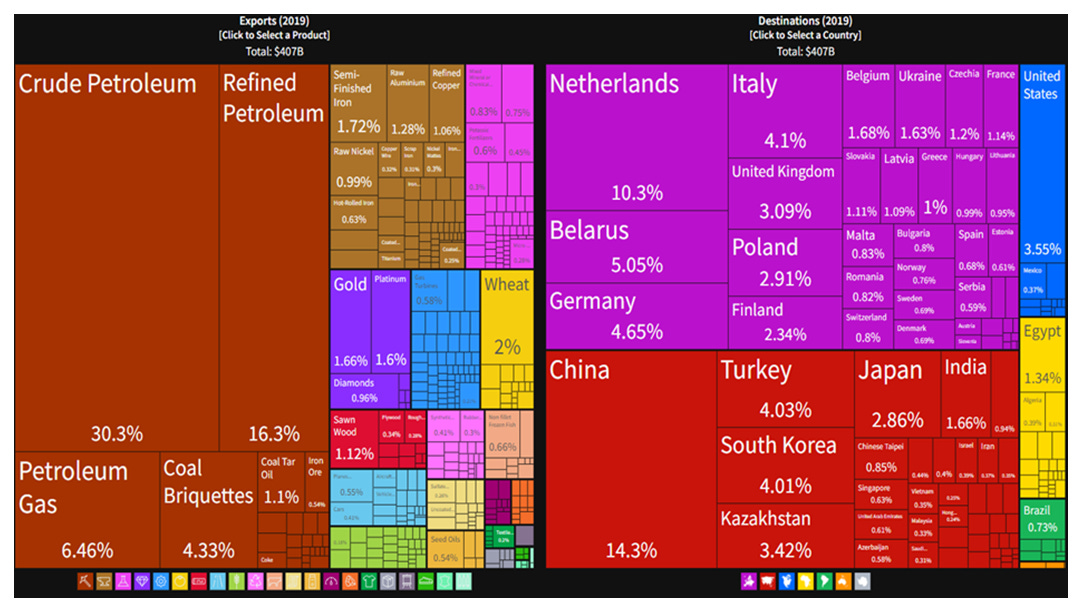
Source: https://oec.world/en/profile/country/rus
More than half of its goods are exported to Europe Russia does not have a lot to offer to Germany except for energy, therefore less than five percent of Russian exports are destined to Germany. On the other hand, German imports constituted the largest share of total Russian imports, 13%. The low-technology economy imports a lot of manufactured products. These includes electric components and vehicles that the Kremlin now use to attack Ukraine, c.f. Figure 4.
Figure 4. Russian imports in 2019.

Source: https://oec.world/en/profile/country/rus
Russian products only make up one percent of total domestic final demand in Germany.
Much of the talk about the “dependency” on Russian gas has been about Germany. In total, Russian products are of less significance for total German final demand than you might think. They make up more of final demand of products by energy industries. Those numbers are relative to final demand for those goods. They should be read with caution. If I showed the same table for Sweden, the Russian share would be something between 90 and 100 percent. But that is irrelevant because the Swedish domestic final demand of that kind of energy is very small. So, what matters is the Russian share of total domestic final demand. And Russian products only constituted one percent of the value of total German final demand in 2018, c.f. Table 1.
Table 1. Value added shares in German final demand in 2018.
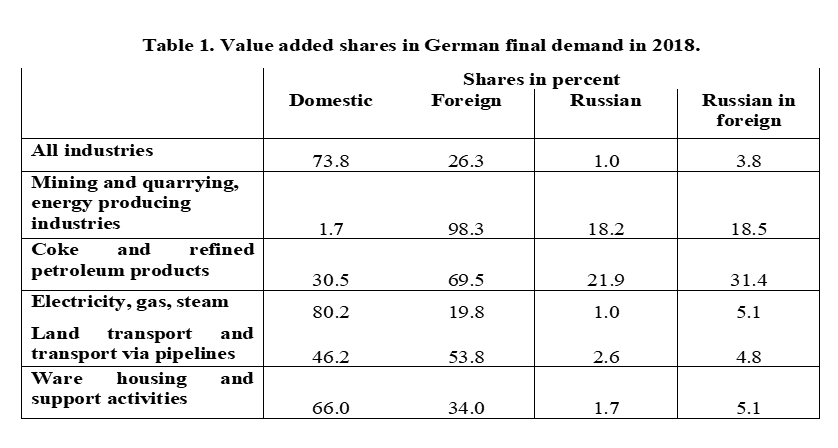
Source: OECD database. Trade in value added indicators. Note: the information in the table is based on “Indicators based on the origins of Value Added in Final Demand” https://www.oecd.org/sti/ind/measuring-trade-in-value-added.htm
This is a small comfort for energy-intensive industries that use Russian gas and oil, not to mention all households whose households are heated with Russian gas. Or in fact, all households since the EU energy markets are connected.
Russian shares constituted less than four percent in total foreign shares of German domestic demand in 2018. Considerably more of final demand of energy and -related products. But as mentioned above, these numbers are less relevant. Therefore, only Russians shares in total domestic final demand will be shown below. Kazakhstan and Russia have strong economic ties, especially in the energy-producing industries. Energy constitutes a relatively large share of Kazakhstan’s final domestic demand.
On average, Russian products make up less than one percent of total domestic final demand in the EU.
Russian shares in final demand in East-European countries are larger than average. The relatively large shares in Cyprus are to large extents explained by the financial industries as Russian oligarchs use Cypriote banks to launder money. On average, Russian shares only amount to 1.3% of domestic final demand in other countries. In the EU28, where the UK is included since data refers to 2018, Russian shares only account for one percent of total domestic final demand, c.f. Figure 5.
Figure 5. Russian shares of final domestic demand in Europe in 2018 (%).

Source: OECD database. Trade in value added indicators. https://www.oecd.org/sti/ind/measuring-trade-in-value-added.htm
We use Russian products for our exports, but, on average, they only constitute 1.3% of total value added in EU exports.
Russian products are not only absorbed domestically, but they are also used in the production for exports. The extents to which Russian products are used for that purpose can be shown by calculating the Russian value-added shares in other countries’ gross exports. Russian value-added content shares are relatively large in Bulgarian, Lithuanian, and Cypriote gross exports but only amount to 1.2% of German and EU28 gross exports, c.f. Figure 6.
Figure 6. Russian value-added content shares in other countries’ exports in 2018 (%).

Source: OECD database. Trade in value added indicators https://www.oecd.org/sti/ind/measuring-trade-in-value-added.htm
This is not the end for us. It is the beginning of the end for the Kremlin.
Sanctions will hurt export firms in Bulgaria, Lithuania, Cyprus as Russian intermediate products make up for larger shares in Bulgarian, Lithuanian, Cypriote exports.
All the calculations above are made with 2018 data, reflecting trade flows, technology, prices and quantities for that year. Russia is not large enough to influence world market prices for anything but gas. Higher prices of gas increase the Russian shares. To make a large difference, those price increases would have to be very large.
But we are in a much better situation to handle economic crisis than Russia. The idiot in the Kremlin has not made anything to improve the functioning of the Russian economy for years. As I demonstrate here, Putin has created his own version of a Middle-Income Trap for Russia. It is a stagnant low-technology economy which I show here. Even if he hadn’t started the war, his fossil fuel czardom was doomed..
My next post will show how dependent Russia is on us.
Russian dependency on us is very bad news for Putin.
He is fucked.
