


Labour market integration of refugees is improving in Sweden
A positive trend.

Spoiler: Integration of immigrants in Sweden is improving. This is true however one measures integrations: employment, incomes, wages as share in disposable income, and self-sufficiency.
For years there has been a heated debate about the integration of immigrants on the labour markets. The debate has been very confused. It has often been difficult to understand what diffent sides of the debate has been arguing about. Many don’t bother to distinguish between immigration of refugees and their relatives on the one hand and immigration of workers with or without already organised employment on the other hand.
The discussions of integration on the labour market have touched upon topics as how soon people get employed, for how long they are employed, the duration of employment, the number of hours per week they work, how much they earn, and how much they contribute to public finances.
Having a temporary job a few weeks per year doesn’t necessary mean that a person has established herself on the labour market. A permanent full-time employment with a regular income of a certain amount is more indicative of a persons’s labour market status. The amount of income is sometimes defined in absolute terms as price base amounts, and sometimes relative to Swedish born employees. The discussion of the absolute income level is often focused on whether the income is high enough for a person to provide for herself, i.e. be self-sufficient or has to depend on the public sector to achieve a certain living standard.
Whether immigrants are self-sufficent or not have implications for the fiscal consequences of immigration. In the beginning of their residence in Sweden, refugees recieve different kinds of support. When they begin to work, they pay taxes. Immigrants who arrive because they have a job waiting for them, are net contributors to the public budgets while many refugees may never become net contributors.
Integration is improving in terms of employment.
Ruist (2018) analysed labor market integration of refugees 20-54 years of age who arrived in Sweden from different countries between 1982 and 2014. He defines labour market integration as being employed with an annual income that is higher than 40 per cent of the median income of 20-50-year-old Swedish born men in the same year.
Ruist shows that the integration process slowed down after the 1980s. Refugee integration was considerably faster in the 1980s than what it has been thereafter. As Ruist pointed out, the macroeconomic conditions during the 1980’s were characterised by unsustainable fiscal policies which in the end led to our own homemade financial crisis in the beginning of the 1990s. The integration levels during the 1980s might therefore have been exceptionally high and not very suitable as benchmarks. Especially not for the refugees who arrived in the beginning of the 1990’s.
Unfortunately, the data used by Ruist which shows employment for certain levels of income, an annual income that is higher than 40 per cent of the median income of 20-50-year-old native men in the same year, are not publicly available on Statistics Sweden. I therefore have to do with data showing employment for all levels of income. By complementing employment data with income data, and data on income transfers, I think I can show that integration is improving.
I will look at employment rates for refugees arriving at different years between 1997 and 2001. One way to compare employment rates for refugees arriving at different years, is to look at how many years it takes half of them to be employed. In order to make the graph more readable, I show only every third year of arrival.
It took eight or nine years for half of refugees arriving in 1997, 2000 and 2003 to be employed. It took two years less to reach the same rate of employment in 2006 but the Global Financial Crisis prolonged the time to reach the 50 percent employment rate. This is shown by the line representing 2009 crossing the 50 percent rate to the right of the line representing the arrivals of 2006. The graph also shows the importance of the business cycle for integration. The strong influence of the business cycle is discussed more in Åslund et. al. (2017).
Integration measured this way, employment at all income levels, has improved since 2009. It took only three years for half of the refugees, that arrived in Sweden in 2019, to be employed. Adding that to the figure below would yield a line with an even steeper slope than the 2018 line in the figure below. Thirteen percent of the refugees that arrived in 2022 were employed in the same year.
Share of employed refugees 20-64 years of age arriving between 1997 and 2022
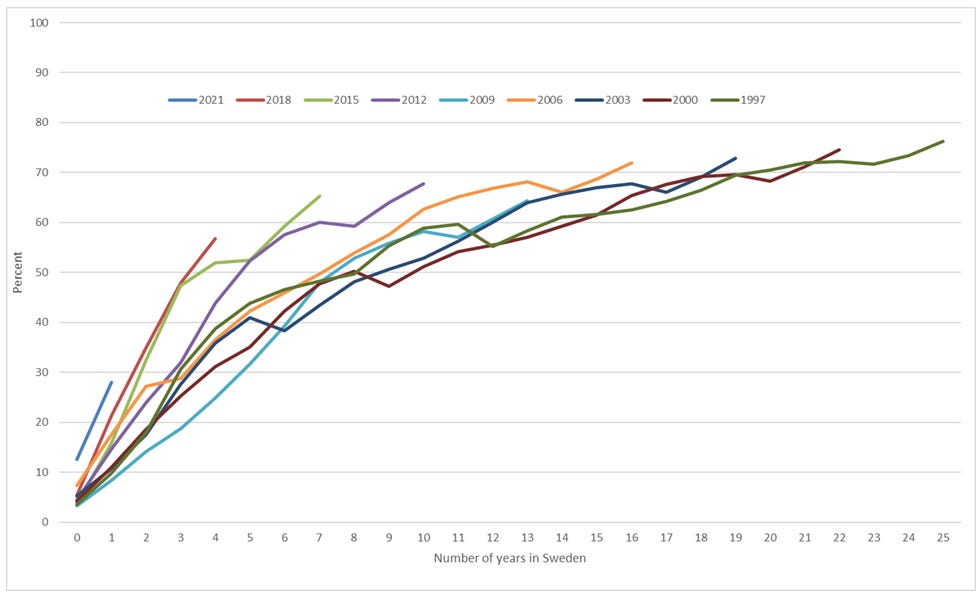
Source: Statistics Sweden, https://www.statistikdatabasen.scb.se/pxweb/sv/ssd/START__AA__AA0003__AA0003B/MotFlyktAldKon/
Labour market participation for refugees have improved relative to labour immigrants. Relating employment of refugees to labour immigrants, show that since 1997 have the relative employment rate increased from 48 percent to 92 percent.
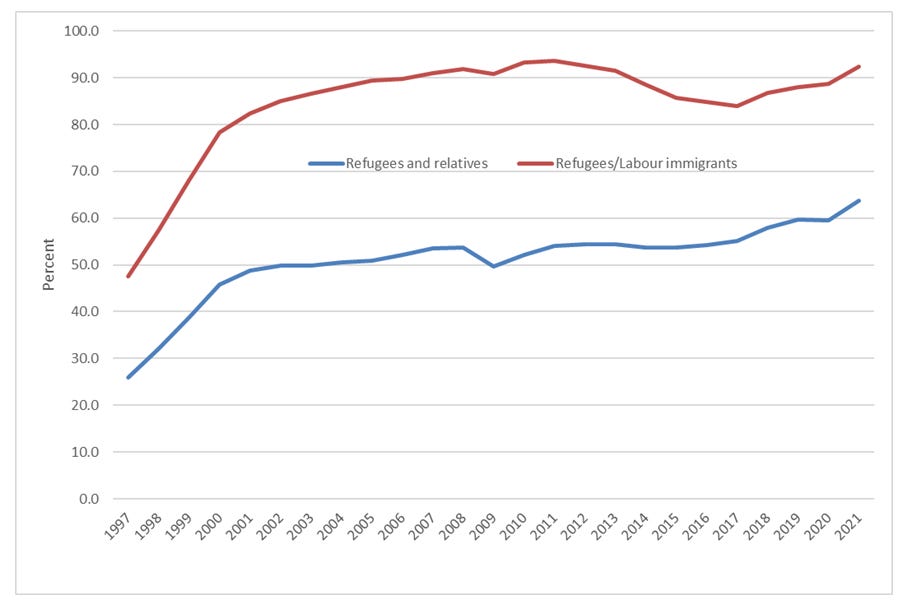
Source: Statistics Sweden, https://www.statistikdatab
asen.scb.se/pxweb/sv/ssd/START__AA__AA0003__AA0003B/IntGr1RikKonUtb/
Refugees’ employment rates have increased also relative to labour immigrants. However, since the data, shown in the graphs above, shows employment at any level of income, integration measured this way is faster than the analyses by Åslundet et.al. (2017) and Ruist (2018). My graph above therefore needs to be complemented by data on income for refugees.
Integration is improving in terms of income.
Integration in terms of income can be measured in at different ways. A person’s or household’s income can be specified either as an absolute amount, or as relative to a certain amount such as the median income. One can also show the number and share in people who receive welfare support.
It is also possible to combine absolute and relative measures. Let’s begin by looking at income as an absolute amount for employed immigrants with a taxable income, and thus an income statement from an employer. In Statistics Sweden’s database one can find data that shows the share of refugees and other immigrants 20-64 years of age with a very low income to all refugees and othe rimmigrant 20-64 years of age. The income is set to 1.5 price base amounts. An income of four price base amounts is considered to be required for self-sufficency.
Even if this data does not provide me with sufficient information to assess integration in terms of the level of employment at a certain income level, it can show whether “income integration” is improving or not. It appears to be improving since the share of employed refugees with very low incomes, in all refugees has decreased from 43% in 1997 to 11.5% in 2021.
Percentage people with taxable income less than 1,5 price base amounts 1997-2021.

Source: Statistics Sweden, https://www.statistikdatabasen.scb.se/pxweb/sv/ssd/START__AA__AA0003__AA0003F/IntGr5RikKON/table/tableViewLayout1/
Merely having an income above a certain, very low, threshhold does not show whether your actual income is enough to pay your bills without support from the welfare state. Even so, fewer refugees need welfare benefits today than since the beginning of the Millennium. The shares of welfare benefits in immigrants’ disposable income have decreased from more than 9 percent of refugees in 2002, to slightly less than four percent in 2021.
Shares of welfare benefits in immigrants disposable incomes 2002-2022. Percent.
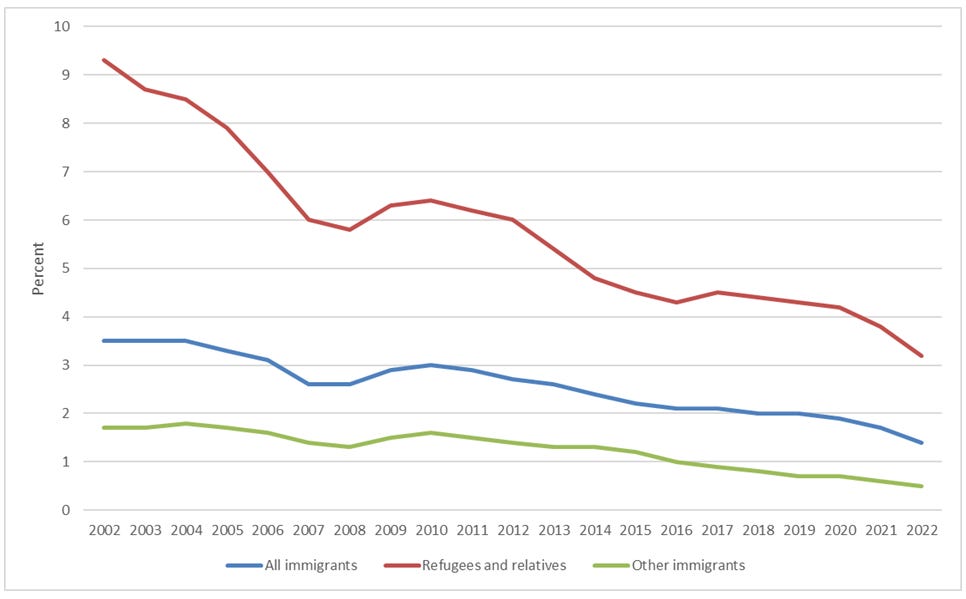
Source: Statistics Sweden, https://www.statistikdatabasen.scb.se/pxweb/sv/ssd/START__AA__AA0003__AA0003G/IntGr4RikKON/
Immigrants are becoming more self-sufficent.
The issue of self-sufficiency has gained a lot of attention in the debate. It is not always easy to understand the arguments put forward because the concept is used in different ways. Most people seem to agree that self-sufficiency means the ability to support oneself by being employed or running a business yielding enough money to pay taxes in excess of transfers from the state.
However, a source of confusion seems to be that some people talk about self-sufficency for individuals while other discuss it in terms of households or consumption units. The choice between the two matters for the choice of time period for which self-sufficiency is analysed. For individuals, it makes more sense to choose a life-cycle perspective. Youngsters and old folks do not in general work so they receive transfers in excess of taxes. But between education and retirement, most people pay taxes in excess of transfers and are self-sufficient. At a given point in time, the relevant unit is the household as discussed in the next paragraph.
Another source of confusion arises in the way self-sufficency is measured. Measuring it relative to an absolute amount, e.g. four price base amounts, 229200 for an individual does not make sense. Excluding youngsters and pensioners does not help. The relevant unit is of course the household, or the consumption unit. In some households, one of the persons may have an income that more than covers the four price base amount limit for two or more people. This could reflect the matter of choice in the household instead of a disability to earn a decent income.
Including the youngsters and old folks do not make much sense, so serious analyses exclude those and instead only look at people with positive disposable incomes. Self- sufficiency is then defined relative to disposable income. A payment of taxes in excess of transfers relative to disposable income yields a self-sufficiency rate: (Taxes - transfers)/(wage income + capital income + transfers - taxes).
Measured this way, 58% of Swedish born individuals with a positive disposable income aged 20-70 years of age, were self-sufficent in 2016 compared to 44% of immigrants from Europe and North Americe and 25% of immigrants from the rest of the world.

Source: Hansson, Å. & Tjernberg, M. (2021)
The debate on how to measure self-sufficiency goes on. Statistics Sweden has been given an assignment to improve the measure of self-sufficency, so we will hopefully know more in the future. But we already know that immigrants’ self-sufficiency have increased. Statistics on employment, income and its components, show this.
Immigration and public finances
On average, an individual makes a positive contribution to public finances during her working age period by paying taxes, creating GDP and incrasing the capital stock. She also receives transfers and consume public services which are subsidised and financed by taxes. Before and after the working age period, she receives different kinds of transfers and consume more of public services, e.g. child and elderly care. The longer time it takes for an individual to enter the labour market, the shorter is the period of time while she makes positive contributions, and the longer is the period of time during which she recieves transfers.
Over the years, a number of studies have analysed this question, both for all immigrants and for refugees. Ekberg (2009), Flood & Ruist (2015), Aldén & Hammarstedt (2016), and Ruist (2018) all reach the conclusion that immigrants’ net contribution to public finances are negative. In Ruist’s (2018) online English summary one can read that:
The results show that refugee immigration has a negative fiscal impact, both in the short and the long run. The cost is highest in the first few years after immigration. Over a certain part of their time in Sweden, the average refugee makes a positive net fiscal contribution, yet not large enough to cover the initial deficit, and the deficit that appears later as they reach retirement age.
However, as Ruist points out, the negative contribution is peanuts:
Numerical estimates are highly uncertain, but indicate that the net fiscal transfer to the average refugee, over their entire lifetime in Sweden amounts to, on average, 74,000 kronor per year. By comparison, the net transfer to the average refugee in Sweden in 2015 was 60,000 kronor.
Can better and more immigration make up for an ageing population? Unfortunately not.
Alas, as I wrote in this post.
We need more people to work longer!

Spoiler: In a previous post I argued that the lower growth of Swedish GDP per capita is a consequence of our own choice. As our incomes grew over time, we began to consume more services instead of goods. The shift in demand led to a reallocation of labour and capital from the more productive goods-producing industries to services. Thus, Services industr…
As demographic analyses show, net immigration cannot permanently compensate for an ageing population where the life expectancy increases. The Immigrants needed to compensate for an increased share of older people in the next decade, themselves approach the retirement age twenty years later. That requires an even larger group of immigrants to compensate for the increase of newly retired. This process would then need to repeat itself for every generation with larger net immigration. Simulations in this report show that to keep the 2015 age structure constant until 2080, a net immigration of 38.1 million would be necessary which corresponds to an increase of the population by some 440%.
The required net migration is so large because its effect on the age structure is much smaller than an increased fertility rate.