


Is Sweden back on track?

Spoiler: the answer is maybe. In terms of GDP, in the second quarter of 2021, GDP was back at its pre-corona level back fell back again when the Omicron variant turned up. The labour market has not recovered, the unemployment rate is two percentage units higher than its pre-corona level.
Some industries were harder hit than others. Contact- and labour-intensive industries like Trade and Tourism and Arts, Entertainment and Other Services are well below their pre-corona levels. Firms in all industries have tried to hold on to their employees as Hours worked declined more than Employment.
In September 2021, more than half of the industries showed positive changes of production relative to 12 months earlier. However, the Omicron variant may have put an end to that development. Industries producing computers, and electronic products as well as industries producing chemicals and pharmaceuticals and information services have increased their production since the Corona crisis began. On the other end of the spectra are transportation services and trade where production has declined.
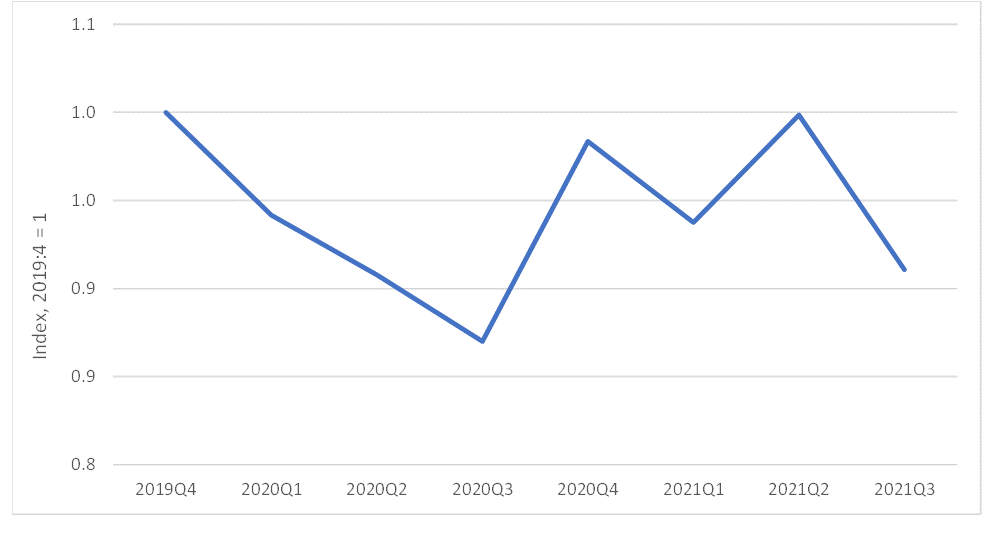
As other economies, the Swedish economy took a big hit when the Corona crisis began. The unemployment rate increased by almost three percentage units between the last quarter of 2019 and the third quarter of 2020. GDP decreased by 13% during the same period. Thanx to a lax monetary policy and fiscal stimulus, the economy recovered, and GDP was almost back to its pre-corona level in the second quarter of 2021. However, in the third quarter of 2021, the Omicron variant reversed the positive development, c.f. Figure 1.
Figure 1. GDP in Sweden 2019:4-2021:3, index 2019:4 = 1.
Some industries have fared better than others. As pointed out in this study, most affected industries are Services industries, in particular the contact-intensive where production and consumption require close contact between employees and between customers and service providers.
Trade and Tourism and Arts, Entertainment and Other Services are contact-intensive. These include transportation services, hotels and restaurants, cinemas, theatres, and different kinds of personal services. Their value added are still well below the pre-corona levels. The Corona crisis have meant that a lot of people work from their homes, thus increasing the demand for IT and Telecommunications Services. Firms have been reluctant to let their employees go, which shows up in larger declines in Hours Worked than in Employment, c.f. Table 1.
Table 1. Numbers of employed and hours worked in 2021:3 relative to 2019:4 in the Swedish industries.

Source: https://www.statistikdatabasen.scb.se/pxweb/sv/ssd/ Note: Industry includes mining, manufacturing and utilities (NACE codes B-E). Trade and tourism includes trade, transportation services, hotels and restaurants (G-I).
The table above shows developments for very broad aggregates of industries. To see developments within these aggregates, one needs to use more detailed data. Below I repeat the two graphs I used in this post about the same depressing subject. The show the developments across Swedish industries over time. The developments are measured by changes in production value indices
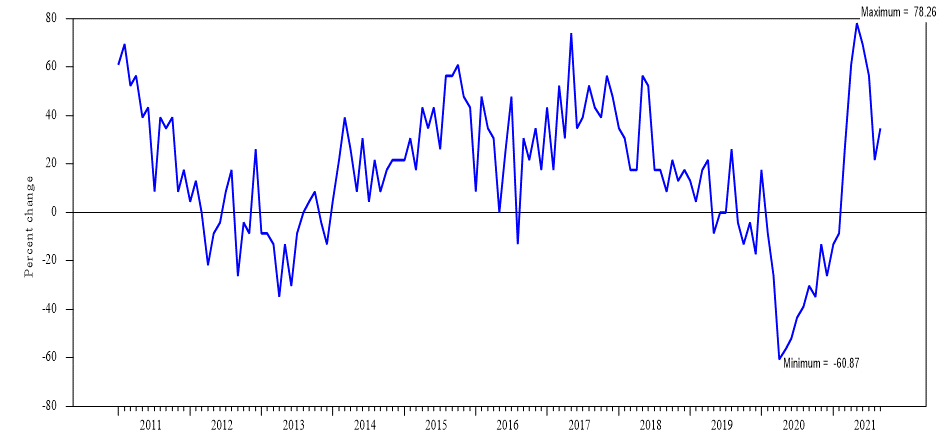
The first graph shows the diffusion index for 46 different industries. The diffusion index is the difference between the percentage of industries that are growing and the percentage of industries that are declining. Growing means that an industry’s production value index is increasing compared to 12 months earlier. Declining the opposite.
The graph shows developments between January 2011 and September 2021. Following the outbreak of Covid-19, the diffusion index declines sharply and reaches -61 in April 2020. That low is then the benchmark for the very high values a year later in April and May 2021, c.f. Figure 2.
Figure 2. Diffusion index for Swedish industries, 2011:1-2021:9.
Source: Statistics Sweden. https://www.statistikdatabasen.scb.se/pxweb/en/ssd/START__NV__NV0006__NV0006A/PVI2015FastM07/
The high positive values in the figure above are dependent on the very low values 12 months earlier. It is not easy to understand what is going on in the last part of the graph. Has the Omicron reversed a positive development, or may we still be on a recovery? I’ll come back to this issue in the Spring.
Anyway, the industries that took the heaviest hit in terms of the largest declines of production were Air Transportation Services which hit rock bottom in June 2020 with a 92% decline in production compared to September 2019. Other industries that were very hard affected during this time, were the Motor Vehicles Industries, Hotels and Restaurants, Sea Transportation Services, and Warehouses and Auxiliary Transportation Services.