


Is labour market integration for refugees in Sweden improving?
Hard to say du to errors in Statistics Sweden's database.

Spoiler: The information in Sweden Statistic’s database on refugees’ incomes is wrong. I am not claiming this without reason. I asked them about a time series that looked very strange and got a reply that the database needed a revision. That should have been done by now. But when I found another problem, I received an email that the revision will be finished in June. Meanwhile, the wrong data is still available on their website without any comments on its reliability and valitdy.
I began to write a post about integration of refugees on the Swedish labour markets. It seems to have improved since the time to reach a 50 percent employment rate after arrival to Sweden has become shorter over the years.
Share of employed refugees 20-64 years of age arriving between 1997 and 2021.

Source: Statistics Sweden, https://www.statistikdatabasen.scb.se/pxweb/sv/ssd/START__AA__AA0003__AA0003B/MotFlyktAldKon/ Note: In order to make the graph more readable, I show only every third year of arrival.
The graph above shows employment at any income level. Ideally, one would like to know the employment rate of refugees at certain level of income. An income of four price base amounts is considered to be enough for an individual to cope without welfare benefits.
I therefore decided to explore Statistics Sweden’s database on income statistics for immigrants. The database contains tables showing the developments of disposable incomes for refugees and other immigrants. I chose the one below showing the median value of disposable income. As you can see, the table shows all foreign born immigrants and refugees and other immigrants separately.
What happened in 2012? Why is there a jump for all immigrants when nothing changes for refugees and other immigrants?
This looks strange!
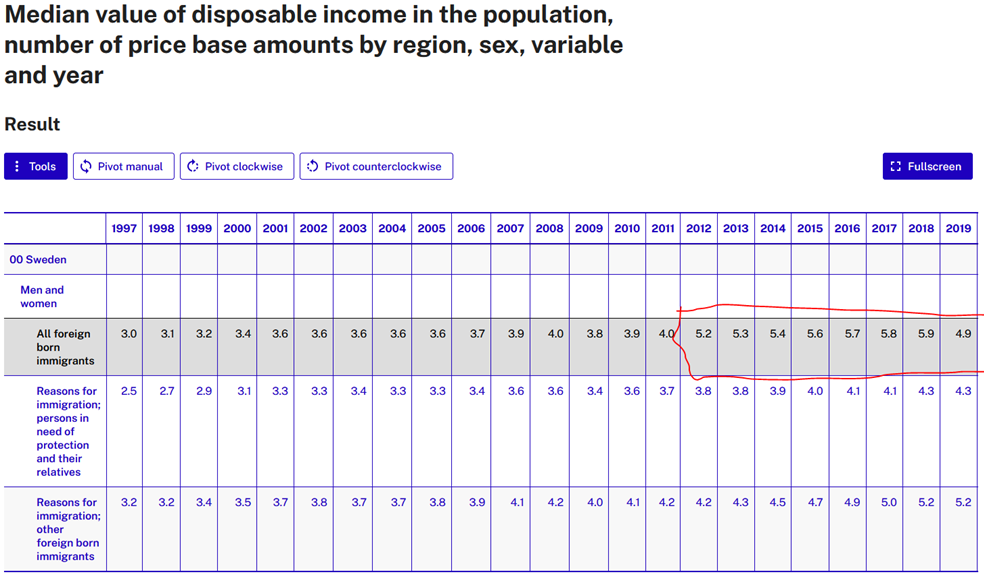
Source: Statistics Sweden, https://www.statistikdatabasen.scb.se/pxweb/en/ssd/START__AA__AA0003__AA0003F/IntGr5RikKON/table/tableViewLayout1/
So, I sent them an email asking about it. They admitted that there was a mistake and told me they would correct it and publish a correct table by the time I’m writing this. Also, they would make a revision of the income statistics. The error in the table above was, according to them, that they had mistakenly published the share of the total population instead of the the share of immigrants.
But. It is the median value, not the mean value! There is no share involved in that. And, they didn’t tell me why the problem started with the observation in 2012 however. And the table is still up and running with the same error as before.
But I didn’t discover that until I first looked at another table, namely this one. I wanted to know if the share of refugees with very low incomes had decreased over the years. So I chose the table below. Since 1997 the share of refugees that have earned very low incomes seems to have decreased significantly. That’s good. But wait, the share in all refugees? No, according to the information at the bottom of the page, link below the screendum, the number of immigrants, refugees and others, with a very low income is calculated as:
The number of persons with aggregated gross salary lower than 1.5 base amounts, divided by the population. Aged 20–64 years.
What! The total population in Sweden aged 20-64 years? That can’t be true. The number of refugees did not amount to 2.2 million in 1997. Time to send another email. And according the reply the number of immigrants, refugees and other, were divided by “persons who hade received cash gross wages, vacation renumerations and other payments larger than 0”.
Basen är personer som erhållit kontant bruttolön, semesterersättning, provision mm som är större än 0.
That is probably one of the weirdest bases for calcuating a percentage I’ve come across. But it can’t be right anyway! How the hell can the share for refugees be larger than the share for all immigrants?
As far as I know All foreign born immigrants = Reasons for immigration: persons in need of protection and their relatives + Reasons for immigration: other foreign born immigrants.
This also looks strange!

Source: Statistics Sweden, https://www.statistikdatabasen.scb.se/pxweb/en/ssd/START__AA__AA0003__AA0003F/IntGr5RikKON/table/tableViewLayout1/
The denominator must be different for the different categories of immigrants.
I really don’t know what’s going on at Statistics Sweden. When I asked for data on the total number of refugees, the number of refugees aged 20-64 years of age 1997-2021, I got a reply directing me here:
Shares of refugees and other immigrants in total immigrants.

Source: Statistics Sweden, https://www.statistikdatabasen.scb.se/pxweb/en/ssd/START__AA__AA0003__AA0003E/IntGr3RikKONU/table/tableViewLayout1/
That’s supposed to be the English version of the table…
I’m not sure whether I will be able to write that post on integration of immigrants.