


How to compare Russia’s military expenditures

Spoiler: Even though Russia has not been exposed to any external threat since the collapse of the Soviet Union, its military expenditures have increased massively since 1999. The media often present confusing and incorrect pictures of the size and developments of Russian military expenditures. This is often due to incorrect conversion of roubles to dollars without taking the lower Russian prices in to account. It is, however, not necessary to convert military expenditures to dollars to compare Russia’s military expenditures to other countries’. Relating countries’ expenditures to other government expenditures in current prices and local currencies give a correct picture of governments’ priorities. Applying that method shows that the Russian government prioritises its military before its people.
The Stockholm International Peace Research Institute has a database of military expenditures which makes it possible to compare such for different countries over time. In order to make comparisons, a classification of expenditures for military purposes has been made. Military expenditures are defined in length here. Oxenstierna (2019) provides a good summary of SIPRI’s definition which includes expenditure for:
”the armed forces and peacekeeping forces; the Ministry of Defence (MoD) and other government agencies engaged in defence projects; paramilitary forces; and military space activities. SIPRI’s definition also includes the full costs of personnel, including pensions and social services; operations and maintenance; arms procurement; military research and development (R&D); and military aid (SIPRI 2018).”
Different ways to measuring military expenditures
Military expenditures are provided in three units. The first unit is local currencies and current prices, the second unit is US dollars and current prices and the third unit is constant 2017 US dollars.
The first unit, expenditures in local currencies and current prices are converted to the second unit, US dollars and current prices by applying annual exchange rates. Those series are meaningless for comparisons unless related to other relevant entities. Conversions of expenditures in local currencies and current prices to constant 2017 US dollars are made in two steps. The first step involves deflating the local currency series. The resulting local currency constant prices series is then converted to constant US 2017 dollars by applying the 2017 exchange rate against the dollar for each country.
The deflators of the local currency prices are not provided in the SIPRI database. According to the methodological document, national consumer price indices are used. SIPRI argues that its choice is justified by opportunity costs. The use of CPIs as deflators can be questioned. It isn’t obvious that buying a new car is the appropriate alternative develop a new type of aircraft. Since military expenditures include physical investments and R&D, I consider the GDP deflator to be a better alternative. But neither is perfect as pointed out by Oxenstierna (2019).
The choice of deflator affects the developments of military expenditures over time. If the GDP deflator increases less than the CPI, military expenditures deflated by the former will increase more over time than if military expenditures are deflated by the latter.
Taking lower Russian prices and wages into account in comparisons of military expenditures
The choice of deflator also affects the level of military expenditures for a given year. Media often report military expenditures for different countries. As a rule, these comparisons do not take differences in price and wage levels across countries into account. In order to do that, purchasing power parities (PPPs) should be used. Applying PPPs for military expenditures 2018 in constant 2011 US dollars show that Russian military expenditures, deflated by the CPI or GDP deflator, expressed in constant US dollars would be underestimated due to a lower price level. It also shows that deflating Swedish expenditures by CPI or the GDP deflator would exaggerate the country’s military expenditures in 2018, c.f. Figure 1.
Figure 1. Russian (left axis) and Swedish (right axis) military expenditures 2018 expressed in constant 2011 US dollars with the aid of three different deflators.
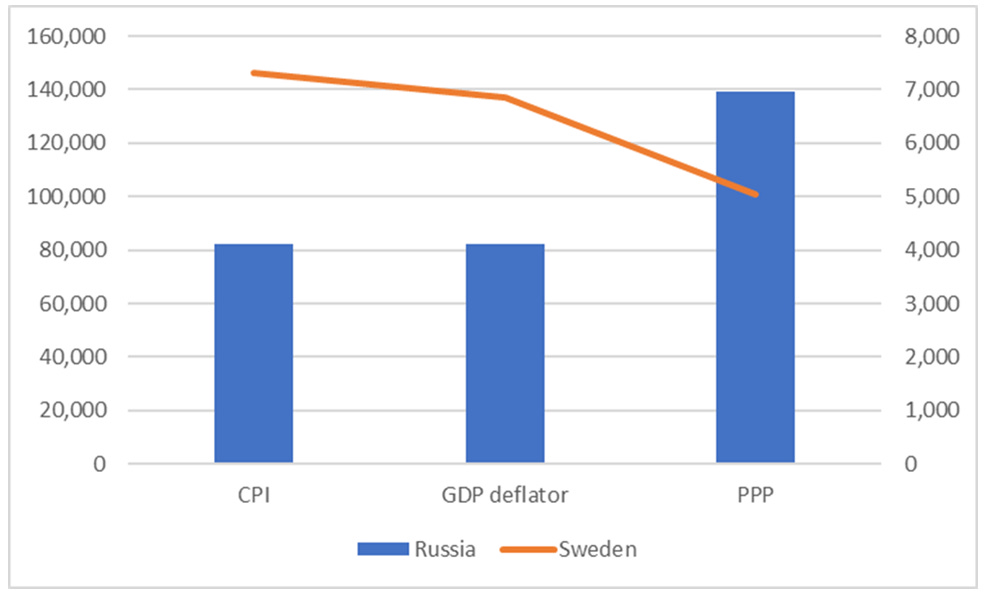
Source: Military expenditures: https://www.sipri.org/databases/milex, consumer price indices and GDP deflators: https://datacatalog.worldbank.org/dataset/world-development-indicators , PPP: https://www.worldbank.org/en/programs/icp
Comparing countries' military expenditures in absolute numbers is meaningless
The military expenditures presented below are expressed in PPPs.[1] Even if one use PPPs to make military expenditures comparable for a certain year, comparisons of different countries’ expenditures in absolute numbers are meaningless. If both Russia and USA spend devote 3% of GDP on the military, American expenditures are much larger in absolute terms since the US economy is so much larger than the Russian. Besides, USA are engaged in many military alliances and have commitments to defend countries such as South Korea, Taiwan and Western Europe against aggressive regimes.
But analysing expenditures over time provide picture of how countries’ military ambitions have changed. Following the collapse of the Soviet Union, military expenditures decreased also in other countries since there was no more a danger of being attacked by the Soviet Union. Wars in the Middle East and Chechnya led to increases in American and Russian expenditures while Swedish expenditures continued to decrease.
Massive increases of military expenditures by Putin…
Russia has not been exposed to an external threat since the collapse of Soviet Union’s military and the Chechen situation became under control in the beginning of the millennium. Putin has nevertheless decided to rearm the Russian military massively, c.f. Figure 2.
Figure 2. American, Russian and Swedish military expenditures in constant price 2011 US dollars (PPPs). 1992-2018 (left), index 1992=100 and 2000-2018 (right), index 2000=100.
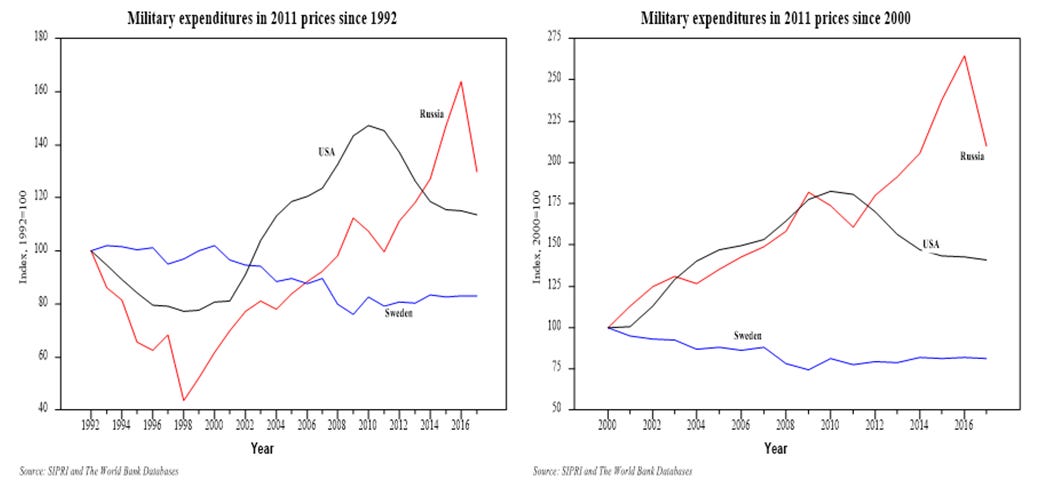
Source: Military expenditures: SIPRI military expenditure database,https://www.sipri.org/databases/milex consumer price indices and GDP deflators: https://datacatalog.worldbank.org/dataset/world-development-indicators , PPP: https://www.worldbank.org/en/programs/icp
The graphs above show that Russian expenditures have increased much stronger than American and Swedish. Expenditures increased by 90%, corresponding to an annual average increase of 3.5%, between 2000, when Putin became president, and 2018. American and Swedish expenditures increased by 52% and decreased by 16% during the same period which corresponds to 2.3% and -1.0% per year.
Russian expenditures in the end of the period are volatile and due to large discrepancies between payments and deliveries over the years. This is explained in detail by Oxenstierna (2019):
“Military expenditure for the years 2015‒2018 includes the return of state-guaranteed credits to the banks that the defence industry could use for the GPV2020, which affects the size of the defence budget for those years.”
The graphs above are useful for comparisons of changes in countries’ expenditures. But as explained above, comparisons of expenditures across countries for a certain year are meaningless.
The correct way to measure and compare countries’ military expenditures, over time and for a certain year, is to relate them to some entity that reflects the governments’ priorities. Below I will relate the expenditures to GDP and other government expenditures. Expenditures relative to GDP reflect how much of a countries resources that a government is willing to spend on the military. A disadvantage with this is that while military expenditures are often determined in plans encompassing several years and therefore are relatively stable, annual changes in GDP can be quite large due to business fluctuations. The resulting changes in the share of expenditures in GDP can therefore be quite large for reasons unrelated to the governments’ ambitions. The measure should therefore be used for analyses stretching over longer periods of time.
…who prioritises military power before Russians’ welfare
Expenditures relative to other government expenditures better reflects a government’s priorities. Other government expenditures include expenditures on health care, education, elderly care, infrastructure and pensions. Such expenditures tend to be relatively high in countries which strive provide their citizens a decent living standard and welfare. In some countries such as Russia, the government and the president cares more about its military than the welfare of its population, c.f. Figure 3.
Figure 3. Military expenditures as shares in GDP and total government expenditures
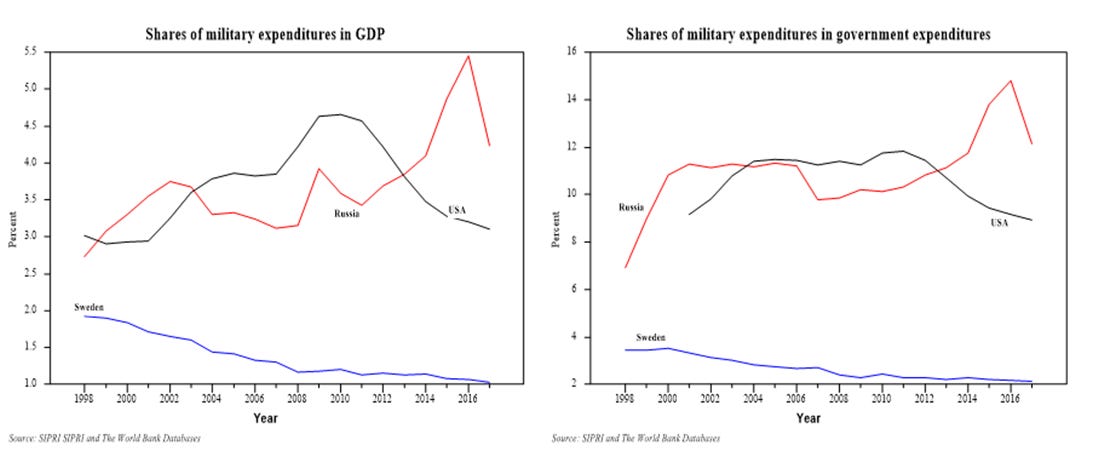
Source: SIPRI military expenditure database,https://www.sipri.org/databases/milex
Read more:
Inozemtsev, V. (2019). Russia’s defence sector: An economic perspective. Utrikespolitiska institutet. UI-brief no. 3, May 2019. https://www.ui.se/globalassets/ui.se-eng/publications/ui-publications/2019/ui-brief-no.-3-2019.pdf
Johnson, D. (2018). VOSTOK 2018. Ten years of Russian Strategic exercises and warfare preparations. NATO Review, 20 december 2018. https://www.nato.int/docu/review/articles/2018/12/20/vostok-2018-ten-years-of-russian-strategic-exercises-and-warfare-preparation/index.html
Oxenstierna, S. (2019). ”The economy and military expenditure”. In Westerstrand, F. & Oxenstierna, S., eds., (2019). “Russian military capability in a ten-year perspective – 2019”. FOI, 2019.
Westerstrand, F. & Oxenstierna, S., eds., (2019). “Russian military capability in a ten-year perspective – 2019”. FOI, 2019.
[1] The choice of currency doesn’t matter if one’s only interested in relative differences between two different years of relative annual average growth rates over time. Expenditures for years other than 2011 are interpolated by using growth rates of series in constant prices.