How prosperous are the Irish?
Very, judging by GDP and GNI statistics but they don't tell the whole story. The Irish Central Bank's modified GNI, GNI*, is a moare accurate measure of Irish prosperity.
Spoiler: Less than implied by the traditional measured of GDP and GNI. Taking into account the large presence of Multinatinal Enterprises (MNEs) changes the picture.
The two most prosperous countries in the EU appear to be Ireland and Luxemburg. As mentioned above, MNEs (foreign owned firms) explain this for Ireland. For Luxemburg, one should also take into account that while the GDP is created within Luxemburg, a lot of people creating the GDP commutes daily from Belgium, France, and Germany. That means that the denominator in the two measures in smaller than had no commuting taking place.
GDP is larger than GNI due to the flow of payments to labour and capital owners, primary incomes. In order to calculate GNI, the net of these flows are added to GDP. Since this flow is negative for Ireland (and Luxemburg), GNI is smaller than GDP, GNI = GDP + net primary incomes from the rest of the world. Primary incomes are the flows of wages, interest and dividends (capital incomes) from the rest of the world. Since GDP is larger than GNI, the net is negative for Ireland. Net primary incomes are found in the Curren Account where also the Goods account, the Services account, and the Current transfers account are found.
The graph below shows that net primary incomes cause the gap between GDP and GNI to be large.
Net primary incomes in the EU 2021. Million EURO
Source: Eurostat, https://ec.europa.eu/eurostat/web/main/data/database
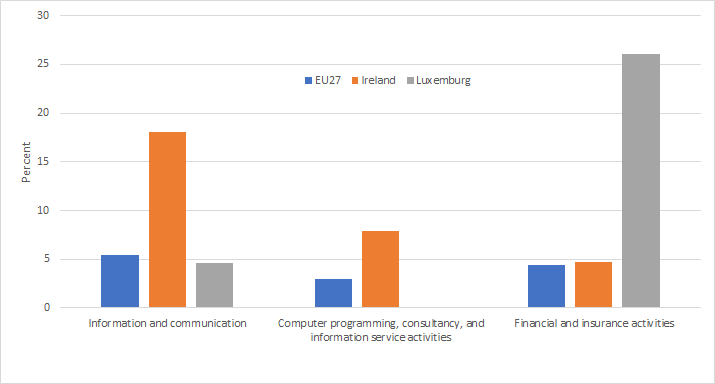
As mentioned above, MNEs have found it beneficial to locate in Ireland and Luxemburg. ICT and Pharmaceutical MNEs like Ireland while Banks prefer Luxemburg. This shows up in relatively large shares of value added for these industries in total value added, GDP in Ireland and Luxemburg. Information and Communciation industries make up for almost four times as much of GDP in Ireland than in the EU, and Banks for five times as much in Luxemburg than in the EU.
Value added in ICT and Banking as shares in total value added 2021 for Ireland, Luxemburg and EU27. (%).
Source: Eurostat, https://ec.europa.eu/eurostat/web/main/data/database
The Pharmaceutical manufacturing industries share should also be included if the data had been available.
But how does the re-location of MNEs from other countries to Irelandexaggerate a country’s prosperity?
GDP and GNI is distorted by MNEs in two ways as the former Governor of the Central Bank of Ireland, Patrick Honohan, explains very clearly in this article. The first distortion has to do with wear and tear of capital . Bringing capital assets with them, the MNEs also added a lot to the depreciation of capital assets. And since GDP and GNI are Gross measures, this increased both GDP and GNI. The second distortion arises becaue after the move to Ireland, that is the move of head-quarters, the profits are included in Irish GDP and GNI even if they are created elsewhere and the shareholders live elsewhere. This caused Irish GDP to jump up 25 percent in 2015.
GNI*
In order to correct for these distortions, the Irish Central Bank has developed a corrected measure of Gross National Income, GNI*. The calculation is described in detail by Philip, R. Lane. The corrected GNI* was on between 23% and 28% lower than the non-corrected GNI for the years 2019-2021.
Source: Irish Statistics, https://www.cso.ie/en/index.html
This corrected measure also explains why the Irish share of private consumption in GDP is lower than in most European countries. For details, see the article by Honohan which I linked to above.


