


Graph of the day – Has Sweden reached Rock Bottom?

It is too early to tell since we haven’t got all the data for May yet. But some banks seem to think so or at least that the recovery is around the corner. Some people talk about a speedy V-shaped recovery. Others think it will take years before the economies reach pre-crisis production levels.
As I pointed out in this gloomy and dreadful post , both demand and supply were shut down. If the financial sector is hit, it will make things even worse. But even without that scenario taking place, it may take a long time. Central banks and governments are trying hard to restore demand and sustain supply, but we don’t know yet how supply chains have been affected. Firms and industries may rethink where to locate production and from which suppliers to source their intermediate goods. This will make everything more costly.
The effect on human capital is also difficult to analyse but might be larger. Workers that become unemployed for longer periods of time often find it difficult to get a new position matching their previous skills and pay. Young workers entering the labour market now, face problems getting a job and acquiring the skills and experience they would need for a long career. Both labour productivity and wage levels, will be lower than if the crisis had not occurred.
But the effects are long-lasting even after the economies have recovered. Adding to what has been mentioned above about distortion of supply chains, and effects on human capital, lower investments and innovation will affect the long-run growth of GDP per capita. Those who find it useful to think about “potential output”, will surely find that its on a lower level even if it should be back on its trend.
But this was a de-rail. I will cover the recovery in a later post. Consider it as a threat and not a promise.
The two graphs below show the developments across Swedish industries over time. The developments are measured by changes in production value indices.
The first graph shows the diffusion index for 47 different industries. The diffusion index is the difference between the percentage of industries that are growing and the percentage of industries that are declining. Growing means that an industry’s production value index is increasing compared to 12 months earlier. Declining the opposite.
The graph shows twelve-monthly changes of the index between January 2011 and March 2020. Following the outbreak of Covid-19, the diffusion index declines sharply and reaches -23 in March 2020.
Diffusion index for Swedish industries, 2011:1-2020:3.

Source: Statistics Sweden. https://www.statistikdatabasen.scb.se/pxweb/en/ssd/START__NV__NV0006__NV0006A/PVI2015FastM07/ Note: The number of industries equals 47 until April 2020. Data is only available for 34 industries in May 2020. For the remaining 13 industries, average change between April 2019 and April 2020 amounted to -16%.
As of today, production value indices are available for only 34 of the 47 industries shown below. Calculating the index for those industries in April yields an index of -52.8. The average decline of growth for the 13 industries with data only until March is -16%. I have therefore no doubt in believing that an update of the graph above will be even worse.
The above figure does not show which industries that are most affected by the crisis so far. We need another figure for that.
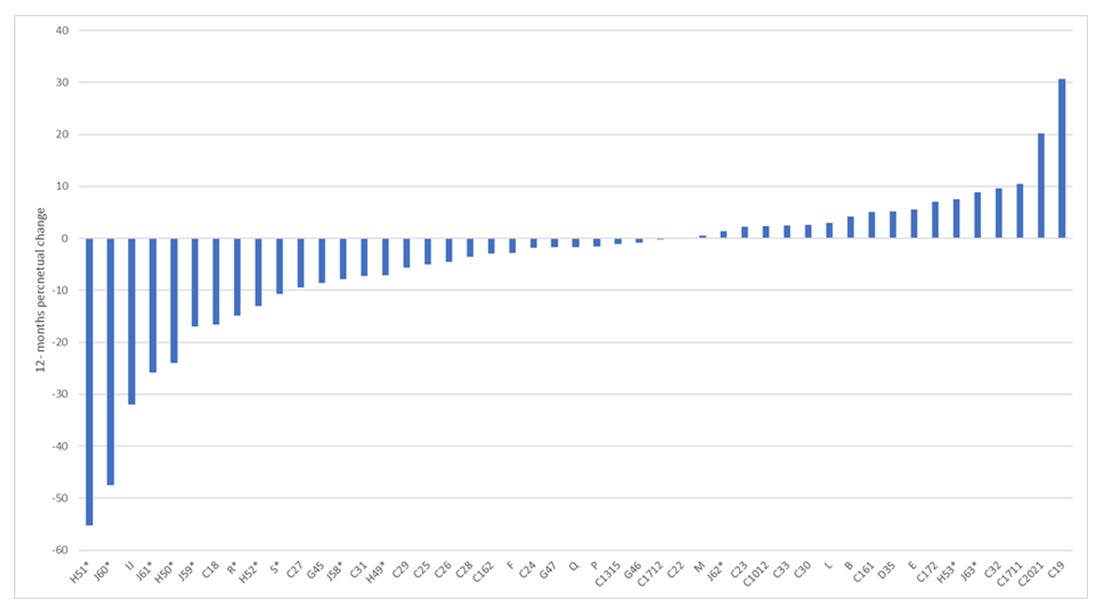
Most affected so far are service industries. These are contact-intensive, i.e. production and consumption require close contact between employees and between customers and service providers. The consumption often also takes place at the same time with other customers. Services are also labour intensive and some of them are sensitive to changes in income, i.e. have high income elasticities. The increased uncertainty about future incomes give households and firms incentive to reduce consumption.
Production in Airlines (H51), Radio- and Tv companies (J60), Hotels and Restaurants (I), Telecom services (J61), and Shipping companies (H50), fell more than 20% between April 2020 and April 2019.
Percentage changes of industry production between April 2020 and April 2019.
Source: Statistics Sweden. https://www.statistikdatabasen.scb.se/pxweb/en/ssd/START__NV__NV0006__NV0006A/PVI2015FastM07/
It remains to be seen how low Rock Bottom is when it is reached. Hopefully, the Recovery is around the corner when the data arrives.