Graph of the day - GDP per capita and life expectancy in Taiwan vs China
I am trying something new today. I usually update my blog only two or three times a month. I do a lot of reading, writing, and editing between those posts before I decide what to write about and then finally how to write it. It does not always turn out well as some readers might have noticed.
As my few readers have noticed, I like to use data to support the arguments I put forward. Sometimes in forms of tables but mostly in forms of graphs. I produce a lot of them when I prepare posts for my blog. Some of them are used in the posts while most find their way in some remote part of the hard disk. Some of the graphs and tables are nice even though I do not use them. Therefore, I begin this new routine.
The graphs and tables will either be used in a future post or were left out in a previous post. Or maybe an update of a graph that I have used in a previous post.
Today’s graph will actually be two. They will be used in a post where I argue that it is about time to recognise Taiwan and give the country its well-deserved place in international organisations. After all, if the brutal communist regime China is represented in the United Nations, why should not the democratic country be allowed in?
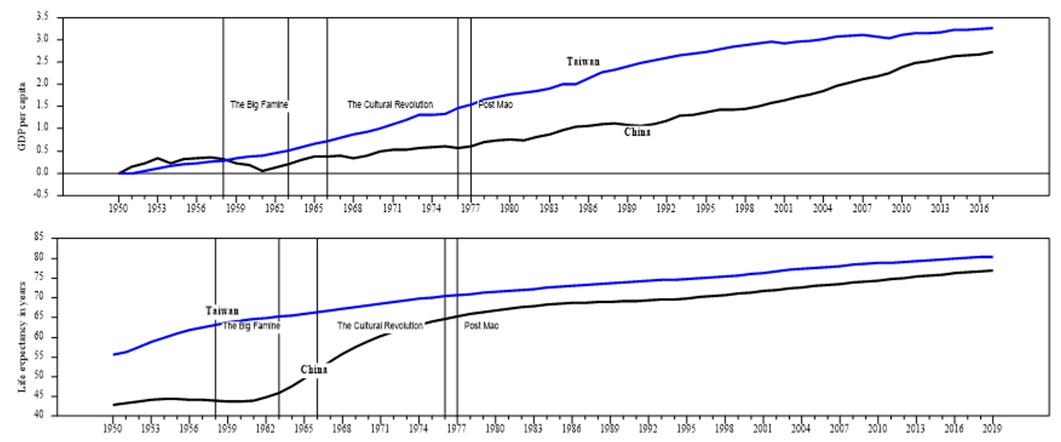
The two countries, China, and Taiwan have chosen different paths of development. This has led to higher prosperity and a healthier population in Taiwan which also is a democratic country while China is ruled by a brutal communist party.
Taiwanese GDP per capita increased fast but remained constant in China. It was not until after Mao died that GDP per capita began to show any significant growth. The catastrophically “Great Leap Forward” aka “Great Famine”, not only led to decreasing GDP per capita but also reduced life expectancy.
In fact, about 30 million people died also reducing world population growth. While “The cultural revolution” was a cruel experiment known in which meant that millions of people were killed and lots of resources were wasted. After China introduced market economy reforms, the gap between Taiwanese and Chines GDP per capita has narrowed, c.f. Figure 1.
Figure 1. GDP per capita (top) and life expectancy (bottom) in China and Taiwan 1950-.
Source: GDP per capita Penn World Table version 9.1 https://www.rug.nl/ggdc/productivity/pwt/ and Maddison Project Database 2018 https://www.rug.nl/ggdc/historicaldevelopment/maddison/releases/maddison-project-database-2018 Note: All series are shown as logs of an index, which equals 1.0 at 1950 so the series start at zero. Since the vertical axis is in log units, the slopes of the series are the rates of growth. An increase of 0.1 is a growth of 100*(exp(0.1)-1). Source: Life expectancyWorld Bank Database. https://databank.worldbank.org/data/source/world-development-indicators#


