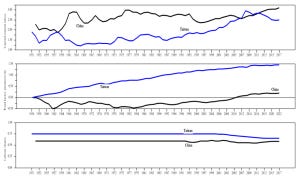
Graph of the Day - Capital-output ratios, TFP and labour shares in China and Taiwan
Also, today’s graph is about China and Taiwan. While yesterday’s graph was about Internet use and abuse, today’s graph is about economic developments again as in the post two days ago.
As noted in the post two days ago, the Chinese economic development was more or less absent while the idiot Mao was alive. Taiwan on the other hand developed fast. Chiang Kai-Shek was also a brutal dictator, but he implemented market economy reforms much earlier than the communist regime.
As noted in the first post, the “Great Leap Forward”, or as it is better known, The Big Famine, was probably the most stupid economic policy ever pursued. The waste of lives is well-known as well as the vast amount of capital, energy and raw material that was used for this idiotic purpose.
As shown in this post, life in communist countries was not only dangerous but also shorter, poorer and dirtier, production in communist countries was much less efficient and used far more resources than in market economies.
Today’s graph which actually are three, show how production in communist China is less efficient than in the market economy Taiwan. It also compares labour compensation in the two countries.
As the top panel shows, with the exception of a few years in the 2000’s, much more capital is needed to gain the same amount of output in communist China than in Taiwan. This should be kept in mind when reading about large Chinese investments at home or abroad. As my post about the Belt Road Initiative showed, many of these investment projects were unprofitable and turned out to be debt traps for the developing countries where Chinese investments were made.
The middle panel shows that not only is capital used less efficient in China. The Taiwanese economy is far more efficient in combining capital and labour and production is also more efficient organised by better management and other stuff entering TFP.
While these two pills might taste bitter and difficult to swallow, the lower panel is the most embarrassing for communist China and its protagonists. Labour shares, defined as labour compensation in GDP, have consistently been higher in Taiwan than in the Workers’ Socialist Paradise China. I am going to rub that in. Capital is rewarded higher in communist China than in Taiwan.
Capital-output ratios (top), TFP (middle) and labour shares in China and Taiwan.
Source: Penn World Table version 9.1 https://www.rug.nl/ggdc/productivity/pwt/ https://www.rug.nl/ggdc/historicaldevelopment/maddison/releases/maddison-project-database-2018 Note: The TFP series are shown as logs of an index, which equals 1.0 at 1956 so the series start at zero. Since the vertical axis is in log units, the slopes of the series are the rates of growth. An increase of 0.1 is a growth of 100*(exp(0.1)-1). Labour shares are often assumed to be constant as they reflect output elasticities w.r.t. labour and capital in a value added framework. Lately, some economists have allowed them to vary.


