


GDP per capita or GDP per hours worked.
What makes up the difference?

This post is trivial for most people that came across an economics textbook. Since I am preparing other posts about differences across countries in GDP per capita growth, I thought I would do a short post about this too. On average, Swedish GDP per capita amounted to 82% of US GDP per capita between 2020-2022. As I shown in previous posts, about growth accounting, GDP per capita can be decomposed into different factors.
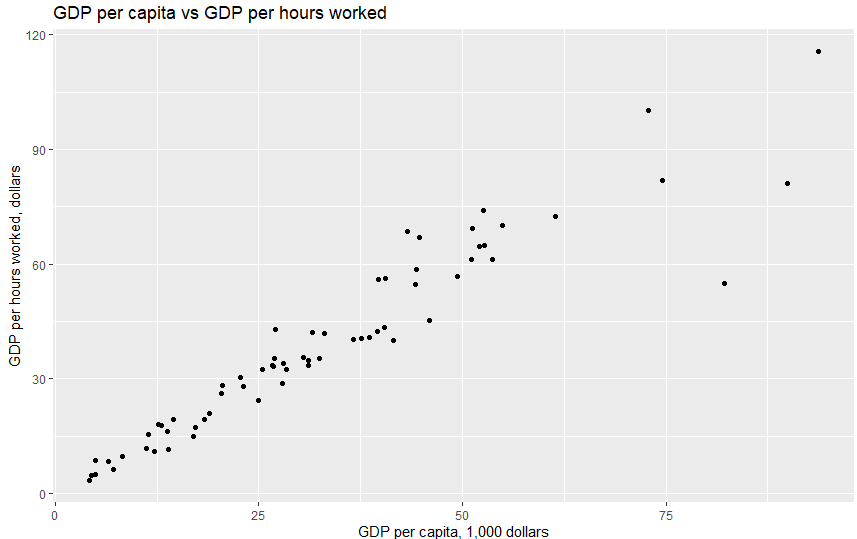
Source: Penn World Tables, Groningen Growth and Development Centre.
GDP per capita, Y/P can be written as the product between GDP per hours worked, average hours worked, the employment rate, the labour force participation rate, and the share of the working age population in total population, as shown below.
where Y denotes GDP, P total population, H total hours worked, L total number of people in employment, Lf total number of people in the labour force (employed + unemployed), Pw the total number of people in the working age population.
Let’s do this for Sweden and USA for 2019. Swedish GDP per capita amounts to 82% of US GDP per capita. Swedish GDP per hours worked amounts to 87% of US GDP per hours worked. This difference shows that that the US economy is more productive than the Swedish economy. GDP per hours worked is generally regarded as a measure of productivity. For countries with the same amount of GDP, countries with a higher GDP per hours worked are able to produce the same amount of GDP with less efforts due to better technology, production processes, management or something else.
The remaining factors reflect differences in business cycle conditions, choices, and legislations. Legislations and choices are not separate phenomena of course. Hours per worker are lower in Sweden because we have chosen to work less and have longer vacations than in the USA. The employment rate in a given year can be affected by business fluctuations but 2019 was a good year in both countries. A difference can also reflect differences in labour market legislations. Firms in the USA may be more prone to hire labour during booms since their costs of lay-offs during recessions are lower. Labour hoarding is generally higher in Europe than in USA. The labour force participation rate was higher in Sweden probably reflecting higher labour supply of women. Finally, the working age population rate may reflect both differences in legislation allowing Swedes to retire earlier, and differences in pensions incentivising Americans to work longer.
Decompositions of GDP per capita for Sweden and USA 2019.

Source: AMECO database, European Commission. Penn World Tables, Groningen Growth and Development Centre. Note: GDP is from PWT, the other variables from AMECO.
And now I found this article by Paul Krugman. I should probably do the Internet searching before I begin to ramble.
How I deviate from offical statistics
At least one of you noticed that my employment rate is higher than official statistics published by Statistics Sweden. They calculate the employment rate as the number of employed relative to the population in the ages 15-74 years or whatever age span is used. This means that their rates of employment and unemployment don’t add up to one or 100%.
If I were to use their definition, I would have to lose my labour force participation rate:
That yields a sligthly different decomposition. Calculating the employment rate as the number of employed relative to the population, results in a higher employment rate for Sweden.
Decompositions of GDP per capita, excluding labour force statistics, for Sweden and USA 2019.

Source: AMECO database, European Commission. Penn World Tables, Groningen Growth and Development Centre. Note: GDP is from PWT, the other variables from AMECO.
I’m not sure about this but I think that the reason for them to calculate the employment relative to the population as a whole, is that they can calculate employment rates for different categories of people. This allows for analyses of differences between different levels of education and more.