


Life in liberal countries is more free and prosperous than in autocratic regimes

Updated post about institutions and prosperity.
In a previous post I showed how a future EU membership gave the Baltic countries, and East European countries incentives to reform their economic and political institutions which shape the behaviour of households, firms and politicians.
This post takes the relationship between institutions and growth beyond the EU.
But in order to do that I think I need to devote some space to what institutions are. But don’t worry, it will be brief and if anyone wants to know more, there are some suggestions to read more at the end of this post.
Without going into too much detail about different definitions of institutions (which you can find plenty of elsewhere but you might begin with North (1991)), I will refer to institutions as formal and informal rules or norms that provide the incentives households, firms and politicians. Economic institutions provide the incentives for individuals to undertake educations, save and invest, innovate and reduce the uncertainty in economic actions by making information more available and the behaviour of others more predictable.
How the economic institutions are shaped is determined in by the political institutions. These institutions determine how a country’s citizens can control its politicians and hold them responsible for their actions. See for example Acemoglu & Robinson (2013) who argue in length that only inclusive economic and political institutions can produce sustainable growth.
Inclusive economic instituions are characterised by secure property rights, open markets with no or low barriers to entry and law and order enabling the enforcement of contracts between business partners. Inclusive political institutions are such that allow broad participation, pluralism, contraints on parties in power.
The opposite is extractive institutions. Under extractive political institutions, the more or less unconstrained executive powers in a country are concentrated to elites which can manipulate the economic institutions in their own favour. Extrctive economic institutions are characterised by insecure property rights, entry barriers and low competition, regulations protecting incumbent firms rents.[1]
I will below show how differences in quality of indicators across countries can be useful to understand differences in growth and prosperity. As indicators of the quality of institutions, I used, in the above-mentioned post, two indicators developed by people in the World Bank; Control of Corruption and Rule of Law. In addition to those two indicators, the World Bank have developed another four as measures of governance, see below. All six indicators are highly correlated, and I therefore only show Rule of Law and Control of Corruption below.
The definitions of the indicators as well as the sources of information needed to construct them and and methodology documents can be downloaded here. The definitions of the two indicators I use below are:
"Rule of law captures perceptions of the extent to which agents have confidence in and abide by the rules of society, and in particular the quality of contract enforcement, property rights, the police, and the courts, as well as the likelihood of crime and violence."
“Control of corruption captures perceptions of the extent to which public power is exercised for private gain, including both petty and grand forms of corruption, as well as "capture" of the state by elites and private interests.”
The indicators range from -2.5 to 2.5 where the higher the value the more is the country in question characterised by Rule of law and the stronger is control of corruption. As you might have guessed there is a positive relationship between these indicators and prosperity, measured as GDP per capita, for many countries, c.f. Figure 1.
Figure 1. Rule of Law vs GDP per capita (left) and Control of Corruption vs GDP per capita (right).
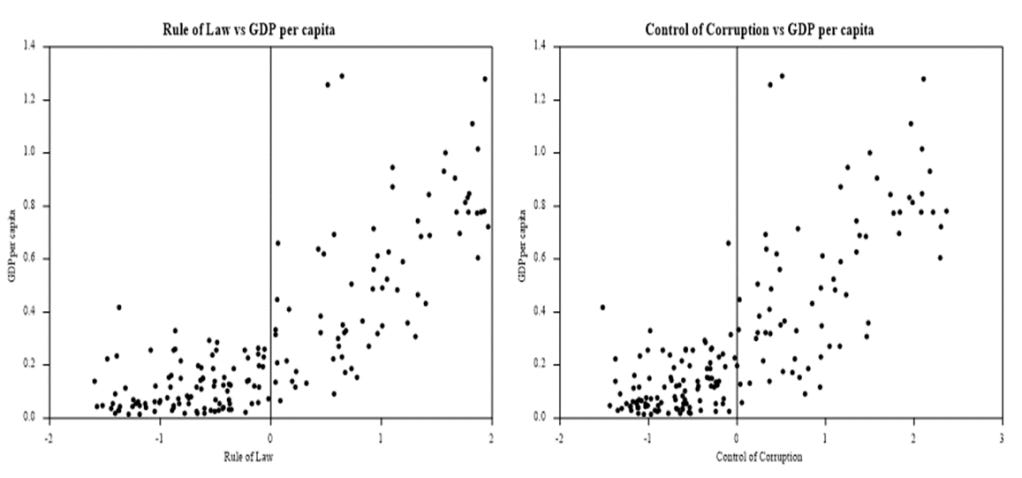
Source: Rule of Law and Control of Corruptionarefrom World Bank, Worldwide Governance Indicators Database, http://data.worldbank.org/data-catalog/worldwide-governance-indicators. GDP per capita is available for download at www.ggdc.net/pwt. "The Next Generation of the Penn World Table" American Economic Review, 105(10), 3150-3182 Note: GDP per capita is calculated relative US. All variables are averages for 1996-2014.
There are a lot of dots/countries in the graphs above. Below I will look more closely at eight of those countries. I have grouped them in four pairs of countries. The two countries in each pair share some similarities but differ with respect to growth. The pairs consist of Madagascar and Mauritius, two islands in the Indian Ocean; Cambodia and Thailand, two neighbouring countries in South-East Asia; Botswana and Nigeria, two resource-rich African countries; and Poland and Ukraine, two neighbouring countries in Eastern Europe previously under Communist rule.
Madagascar and Mauritius have many things in common. Both islands are inhabited by people with different ethnical backgrounds and who speak different languages and belong to different religions. People in Cambodia and Thailand have so far not enjoyed the fruits of democracy. On the contrary, between 1975 and 1978 people in Cambodia lived in constant fear of being murdered by the Khmer Rouge. Cambodia remained a planned economy until 1995 while Thailand liberalised its economy much earlier. Botswana and Nigeria were two resource-dependent countries. Diamonds account for some 60% of Botswana’s exports and oil 80% of Nigerian exports. Botswana is Africa’s oldest democracy with an independent judiciary and effective property rights contrary to many other African countries. Nigeria is regarded a democracy since 1999 but with restricted civil liberties. The Polish economy constituted perhaps the largest economic disaster in the Eastern Bloc but is now an economic success. Polish governments of different political colours have carried out economic and political reforms very carefully which have led to unprecedented growth. Ukraine is on the other hand still a disaster. Its people have been robbed by the its oligarchs who also have controlled the political parties.
Botswana, Mauritius, Poland and Thailand appear as growth miracles with average annual growth rates of GDP per capita amounting to 6.5, 3.3, 4.7 and 4.3 percent respectively. Madagascar, Nigeria and especially Ukraine on the other hand appear as growth disasters as GDP per capita are barely above or still below the initial levels in the graphs below. Cambodia on the other hand seems to be on a path to recovery, c.f. Figure 2.
Figure 2. Variations in growth of GDP per capita across countries.
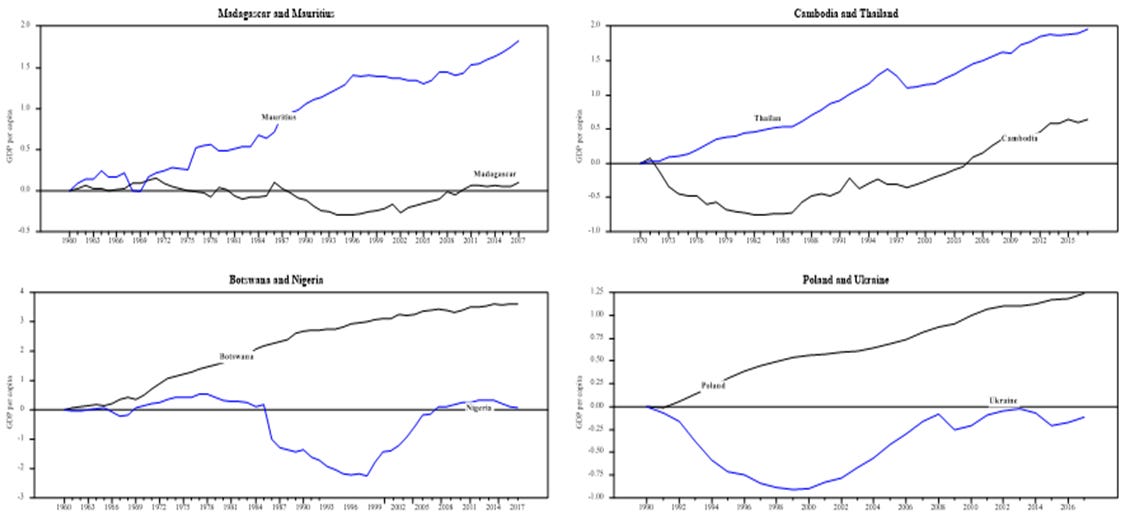
Source: "The Next Generation of the Penn World Table" American Economic Review, 105(10), 3150-3182. www.ggdc.net/pwt. Note: All series are shown as logs of an index, which equals 1.0 at 2000 so the series start at zero. Since the vertical axis is in log units, the slopes of the series are the rates of growth. An increase of 0.1 is a growth of 100*(exp(0.1)-1).
Having looked at Figure 2, it may be tempting to investigate whether developments in GDP per capita and developments of the institutional indicators show similarities for the countries. But the impact of reforms on growth and prosperity is complex and often with a considerable time lag. I will below therefore have a look at differences between the countries in terms of averages of the values of the indicators for 1996 to 2017 as was done for Figure 1. The averages show that those countries with relatively higher GDP per capita also have higher scores of the indicators below. Thailand displays a negative score for Control of Corruption and a relatively low degree of Liberal Democracy, in par with Ukraine, c.f. Table 1.

Source: Rule of Law and Control of Corruption are downloaded from the World Bank’s Worldwide Governance Indicators Database. The Economic Freedom Index is available here. The Liberal Democracy Index is available here and here. Note: Rule of law and Control of corruption range from -2.5 to 2.5, the Economic Freedom Index ranges from 0 to 100, the Liberal Democracy Index from 0 to 1.
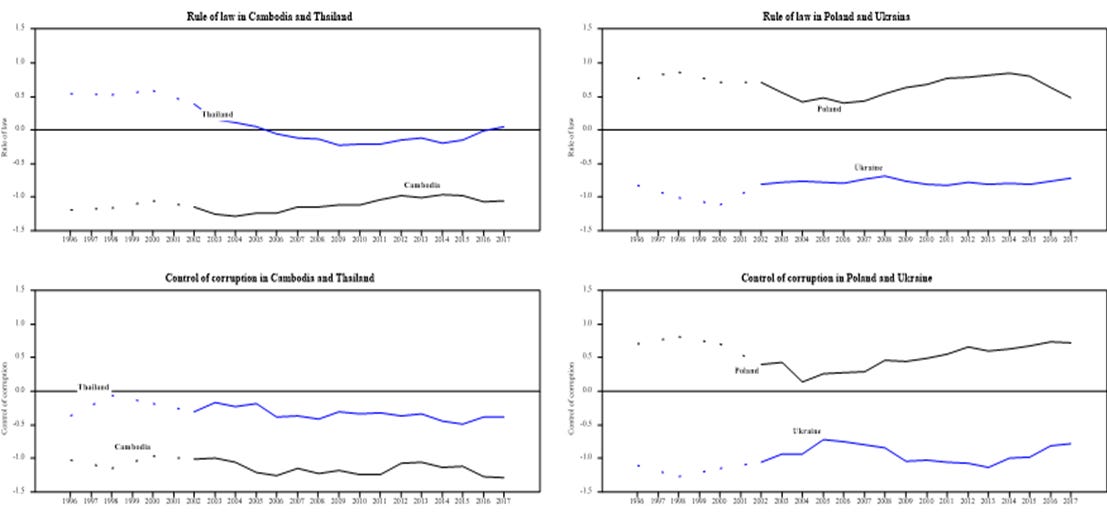
I argued above that one should not try to find relationships between short-run movements of GDP per capita and any of these indicators. I argued above that one should not try to find relationships between short-run movements of GDP per capita and any of these indicators. But recent developments may be indications for the future. Judging recent developments it seems conditions are improving in Thailand. Especially so w.r.t. Rule of law for which conditions previously were deteriorating. In Cambodia, it looks as previous positive developments have been reversed. Turning to Eastern Europe, the Polish government has reduced the judiciary’s independency. In a judgement by The Court of Justice of the European Union, Poland was found to have violated EU law in this regard.
It appears that this and other measures are reflected in the worsened conditions for Rule of law in Poland. On a positive note, corruption keeps getting weaker. Looking at Poland’s neighbouring country, Ukraine, which the IMF and the EU have urged to implement reforms in order to reduce corruption and improve the conditions for Rule of law, we find improvements. Even though the judiciary system still is full of corrupt judges, some improvements are visible even on this aggregated level. And, as expected, control of corruption in Ukraine becomes stronger after the ousting of the corrupt Yanukovych, c.f. Figure 3.
Although eight countries is a small sample, it shows that countries with good economic and political institutions are more prosperous than countries with poor. But it is also possible to achieve high growth with a combination of good economic and poor political institutions as Thailand shows.
History has provided many examples of high growth in countries where both economic and political institutions were poor. By having absolute control over resources and people, the leaders of Soviet Union could move resources from the low-productive agricultural sector to industrial sector with higher productivity. But without the appropriate economic institutions such as property rights and free prices which characterize market economies, the economy was inherently inefficient. When the Soviet Union finally collapsed, some 10% of its labour force was still employed in the agricultural sector.
So, having attained a relatively high level of prosperity after a prolonged period of growth is no guarantee for future prosperity. Nor is it guaranteed that high growth during a period will result in higher quality of institutions. Resource rich countries like Russia provide striking examples of this as I showed here. The Russian political elite has captured the state and designed the economic institutions in a way that protects the oligarchs who support Putin as demonstrated by many scholars, perhaps most recent by Aslund (2019).
Whether China can keep growing is an open question. The reforms of the economy have spurred a high growth for some decades now but sooner or later declining returns of capital will kick in and slow down growth. And the Communist Party does not show any tendencies to allow its people human rights which its close monitoring of developments in Hong Kong show. Hence, there is not much hope that China will follow the examples of South Korea and Taiwan where periods of high growth followed after the establishment of inclusive economic institutions. Unfortunately, China and Russia are examples of how ruling elites which benefit from poor institutions will resist changes that improve those institutions since that would undermine their positions and wealth. But since those instititutions which characterise liberal democracies are associated with higher living standards, sooner or later they will feel that the demands for reforms will be too strong, c.f. Figure 3.
Figure 3. Liberal democracy and prosperity.
Source: Liberal Democracy Index: Varieties of Democracy (V-Dem) Project. GDP per capita. "The Next Generation of the Penn World Table" American Economic Review, 105(10), 3150-3182. Groningen Growth and Development Centre. https://www.rug.nl/ggdc/productivity/pwt/ Note: The liberal principle of democracy emphasizes the importance of protecting individual and minority rights against the tyranny of the state and the tyranny of the majority. The liberal model takes a ''negative'' view of political power insofar as it judges the quality of democracy by the limits placed on government. This is achieved by constitutionally protected civil liberties, strong rule of law, an independent judiciary, and effective checks and balances that, together, limit the exercise of executive power. To make this a measure of liberal democracy, the index also takes the level of electoral democracy into account.
Read more
The Economic Freedom Index, the Liberal Democracy Index and Worldwide Governance indicators
The Economic Freedom Index (EFI)
The EFI is based on 12 quantitative and qualitative factors, grouped into four broad categories, or pillars, of economic freedom:
Rule of Law (property rights, government integrity, judicial effectiveness)
Government Size (government spending, tax burden, fiscal health)
Regulatory Efficiency (business freedom, labor freedom, monetary freedom)
Open Markets (trade freedom, investment freedom, financial freedom)
Each of the twelve economic freedoms within these categories is graded on a scale of 0 to 100. A country’s overall score is derived by averaging these twelve economic freedoms, with equal weight being given to each. More information on the grading and methodology can be found in the appendix. https://www.heritage.org/index/about
The Liberal Democracy Index (LIB)
The index aims to measure the extent to which the ideal of liberal democracy is achieved. The liberal principle of democracy emphasizes the importance of protecting individual and minority rights against the tyranny of the state and the tyranny of the majority. The liberal model takes a ”negative” view of political power insofar as it judges the quality of democracy by the limits placed on government. This is achieved by constitutionally protected civil liberties, strong rule of law, an independent judiciary, and effective checks and balances that, together, limit the exercise of executive power. To make this a measure of liberal democracy, the index also takes the level of electoral democracy into account.
World Governance Indicators
The World Bank’s Worldwide Governance Indicator database, is located at http://data.worldbank.org/data-catalog/worldwide-governance-indicators. It contains indicators intended to measure Governance which is defined as:
”the traditions and institutions by which authority in a country is exercised. This includes (a) the process by which governments are selected, monitored and replaced; (b) the capacity of the governments to effectively formulate and implement sound policies; and (c) the respect of citizens and the state for institutions that govern economic and social interactions among them.”
Voice and Accountability and Political Stability and Absence of Violence/Terrorism measure institutional process, Government Effectiveness and Regulatory Quality measure institutional capacity while Rule of Law and Control of Corruption measure trust and respect for institutions which I carelessly call quality of institutions.[2]
Literature
Acemoglu, D & Robinson, J. A. (2013). Why Nations Fail. Profile books limited, Great Britain.
Rodrik, D., (ed.) (2003). In search of prosperity. Analytic narratives on economic growth. Princeton University Press. New Jersey.
Kaufmann, Daniel and Kraay, Aart and Mastruzzi, Massimo, The Worldwide Governance Indicators: Methodology and Analytical Issues (September 2010). World Bank Policy Research Working Paper No. 5430. Available at SSRN: https://ssrn.com/abstract=1682130
North, D. C. (1990). Institutions, Institutional change, and economic performance. Cambridge University Press, New York.
Piatkowski, M. (2018). Europe's Growth Champion. Insights from the economic rise of Poland. Oxford University Press
Åslund, A. (2019). Russia's Crony Capitalism: The Path from Market Economy to Kleptocracy. Yale University Press.
[1] See Acemoglu & Robinson (2013) and Piatkowski (2018) for more elaborate discussions.
[2] Kaufman, D. et. Al. (2010), s 4.