


Did profits account for most of Swedish industry price increases?
Gross profits should not be analysed since that includes depreciation which plays an increasingly larger role.

Spoiler: A decomposition of the value added deflators in basic prices for Swedish industries 1993-2023, shows that unit net profits accounted for the smallest contribution to industry price changes for the whole Swedish economy. The overall result masks large differences between different industries. Unit net profits matter more for Goods producing industries than Services industries.
But who cares? muscovites kill, rape, torture, and kidnap Ukrainians.
The price changes that I measure are changes in the value added deflator in basic prices. Value added in basic prices equals taxes - subsidies (net taxes) + wages + social contributions (labour costs) + depreciation + net operating surplus. The data is in current prices and is available at Statistics Sweden’s web here. The deflator is calculated by dividing value added in current prices with value added in fixed prices, in this case year 2020 prices which you find here. Value added in fixed prices is a volume measure, Y. So, when you divide the value added in current prices, PY, by Y, you get P. To make sure that the equality (sum) still holds, the components making up value added in basic prices should also be divided by Y.
This yields the price of value added as the sum of unit net taxes, unit labour costs (ULC), unit depreciation and unit net operating surplus (unit net profits). Many analyses lump together depreciation and net operating surplus into profits. But that exaggerates the renumerations of capital owners. They get their share after expenditures for maintaining the existing capital stock.
Below, I will show the changes in the value added deflator over time. I calculate annual average changes for different time periods. The change of a sum is the weighed average of its components. I will below show my calculations for the Whole economy and a limited number of industry aggregates: the Private sector, Goods producing industries, Services producing industries, Construction industries, and Manufacturing industries.
Price changes and its components for the Whole economy.
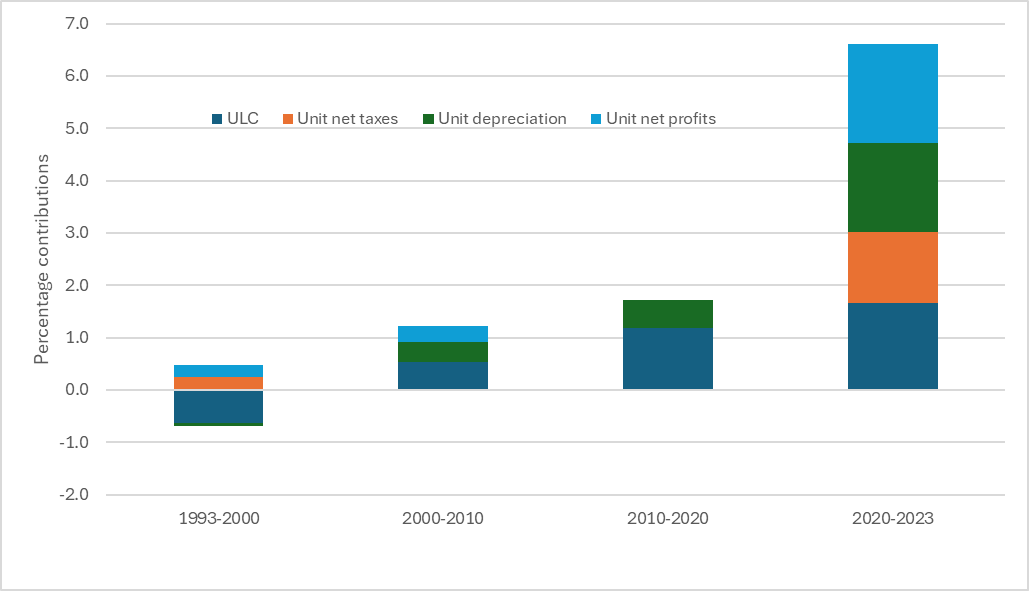
To begin with, the decompostions of the whole economy’s price changes are shown below. Taxes, depreciations and ULC make up for the largest price increases while unit net profits contributions are nil or negative. The largest price increases are recorded during the last three years which include the Covid crisis and the fascist dictatatorship muscovy’s full-scale invasion of Ukraine. The annual average increase of the value added deflator amounted to 4.6%. Most of the increase was due to increases of unit labour costs and unit depreciations. Also taxes contributed while unit net profits did not.
Contributions to price changes in percent in the whole economy for different periods of time 1993-2023.

Source: Statistics Sweden. Note: The whole economy. NACE codes A01-T98 excluding L68A, one and two family homes.
The contribution to price changes from depreciation is reflected in its increasing share in value added over time. Depreciations, which make up for the difference between gross operating surplus och net operating suprlus has increased over time. Not only in Sweden, but also in other countries for a long period of time. But that’s another story to be told by someone else. In 1993, the share of depreciation in total value added for all industries amounted to 20%.
Shares in value added 1993-2023.

Source: Statistics Sweden. Note: The whole economy. NACE codes A01-T98 excluding L68A, one and two family homes. Yes I know, the y-axis should not be truncated but this is a blog, not an article.
Unsurprisingly, unit net profits contribute more to price changes for the private sector though also in the private sector playing a minor role for price changes.
Contributions to price changes in percent in the private sector for different periods of time 1993-2023.

Source: Statistics Sweden. Note: The private sector. NACE codes A01-N82 excluding L68A, one and two family homes.
Goods producing industries and Service industries.
The private sector consists of a large number of firms producing many different sorts of goods and services. Looking at those two categories separately shows that unit profits make up the largest contribution to price changes in the Goods producing industries for the last three years, 1.9% of the total price change of 6.6%.
Contributions to price changes in percent in Goods producing industries for different periods of time 1993-2023.
Source: Statistics Sweden. Note: Goods producing industries. NACE codes A01-F43.
In contrast to Goods producing industries, unit net profits in Services industries had a restraining effect on price changes, i.e. a negative contribution for the last three years. Unit net profits play a small part in price changes for the whole period while ULC contribute most.
Contributions to price changes in percent in Services producing industries for different periods of time 1993-2023.

Source: Statistics Sweden. Note: Services producing industries. NACE codes G45-N82 excluding L68A, one and two family homes.
Goods producing industries’s share in the total private sector has decreased from 42% in 1993 to 36% in 2023. The corresponding shares of Services of course increased from 58% to 64%. Therefore, developments in Services producing industries matter more for the whole economy’s price changes than the developments in the Goods producing industries.
Manufacturing and Construction industries.
The two largest Goods producing industries (aggregates) are Manufacturing industries and the Construction industries. Manufacturing industries accounted for 61% and 56% of Goods producing industries in 1993 and 2023 respectively while the corresponding shares for Construcion industries were 16% and 24% respectively.
Unit net profits have contributed significantly to price increases in the first and last periods. The last period only covers three years of price changes so time will tell if unit net profits’ contribution to price changes will continue to as large. As in the whole economy, the contrtibution of depreciation increases over time.
Contributions to price changes in percent in Manufacturing industries for different periods of time 1993-2023.

Source: Statistics Sweden. Note: Manufacturing industries. NACE codes C10-C33.
Labour costs matters most for price changes in Construction industries. The labour costs’ share in value added in Construction industries is more than 20 percentage units higher than in Manufacturin industries.
Wages shares in Construction and Manufacturing industries 1993-2023.

Source: Statistics Sweden.
Developments in Construction industries matter more not only because of its large labour costs shares and weight in GDP, but also due to lower productivity growth than in Manufacturing. As I noted some years ago here

The historically meagre productivity growth of the Swedish Construction industry is a serious problem. Low productivity growth for an industry does not have to be a problem if the industry is small relative to the rest of the economy. But it is problematic when a large industry’s share in the economy is increasing over time at the same time as its productivity growth is stagnating. The Swedish Construction industry’s contribution to overall Swedish productivity growth is almost as small as the public sector’s contribution.
Contributions to price changes in percent in Construction industries for different periods of time 1993-2023.

Source: Statistics Sweden. Note: Construction industries. NACE codes F41-F43.
What about mark-ups and price setting.
The above offers no explanation to price changes. The graphs only show only decompositions of price change. To discuss how prices are set, one should apply at economic theory like I did in this post:

One point of departure is to derive an expression for a firm’s price under imperfect competition with a Cobb-Douglas production function. Profit maximisation yields an expression like that the one below. The Greek letters alpha and mu represent the output elasticity of capital and a mark-up respectively. The mark-up is a function of the demand elasticity the firm faces for its product. W are wages, Y, output, H hour worked. The second term on the right hand side is therefor unit labour costs.
The expression shows that the price is proportional to unit labour costs. A higher markup, denoted by the greek letter mu, indicates weaker competition on the markets, which tends to increase the price. The output elasticity and mark-up should not change as frequently as unit labour costs so price changes and changes in unit labour costs should move together. The graph below, showing five-year annual average percentag changes of the GDP deflator and unit labour costs, for Sweden shows that it is indeed the case.
Percentage changes in the GDP deflator and Unit Labour Costs for Sweden 1960-2023.
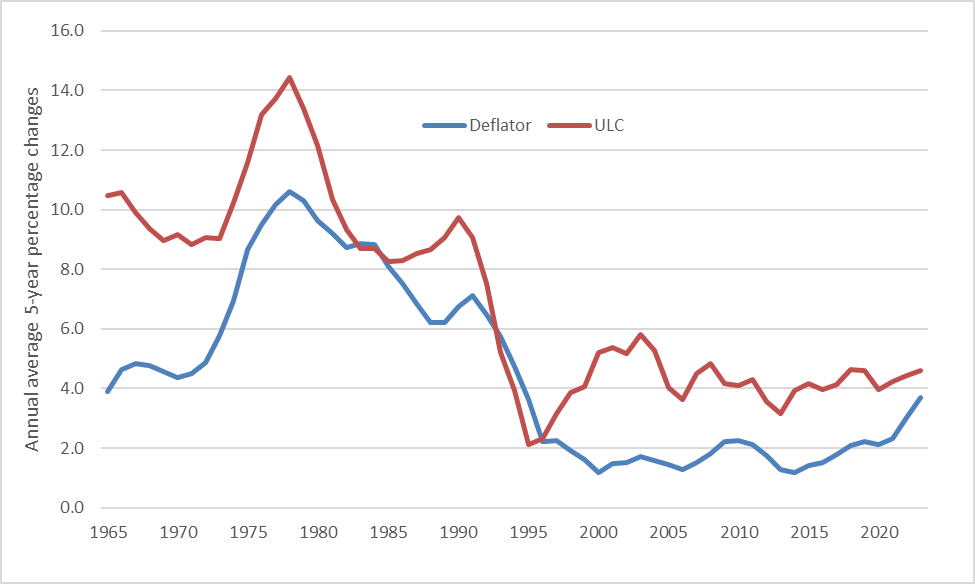
Source: European Commission, Ameco Database