


Belarus would have done better in the EU

Spoiler: The rumoured success of the Belarussian economy spells Russia gas and oil subsidies. The subsidies have propped up the Belarusian economy. Refining subsidised imported oil from Russia and selling it at world market prices provided Belarus with revenues. Much of these have been used to sustain the inefficient State-Owned Enterprises (SOEs).
The oil revenues were also used to decrease poverty and provide the citizens with a decent health care. But Lukashenka’s economic model is not sustainable. For a decade now, growth has been disappointing. The reduced subsidies from Russia has not been helpful but the main cause for stalling growth is the low productivity growth.
A planning-type economy where capital and labour are allocated by bureaucrats according to development plans have preserved the inefficient industry structure. Administered prices and wages have worked in the same direction and prevented renewal of the economy towards a more productive industry structure. Most of Belarusian GDP growth is due to increased amounts of input while contribution from total factor productivity growth is low and practically absent since 2010.
The Belarusian people which already was frustrated over the lack of civil rights, would have been better off if Belarus had joined the EU. The people in the former communist countries, which are now EU members, are not only freer but also more prosperous than Belarusians.
The Belarusian economy is rumoured to be one of strongest growing economies in former communist countries in Eastern Europe. As most students know, relative increases can appear to be large when the initial situation of the “grower” is low. Compared to the former communist, GDP in Belarus is still lower than in countries that became EU members in 2004 and later, c.f. Figure 1.
Figure 1. GDP per capita 2019 in Belarus and other former communist countries.

Source: World Bank Database. https://databank.worldbank.org/data/source/world-development-indicators#
Despite having initially, the lowest GDP per capita of the countries in Figure 1, annual average growth has been lower than in any of these countries since 2010, c.f. Table 1.
Table 1. Average annual percentage growth rate 1990-2019 and 2010-2019.
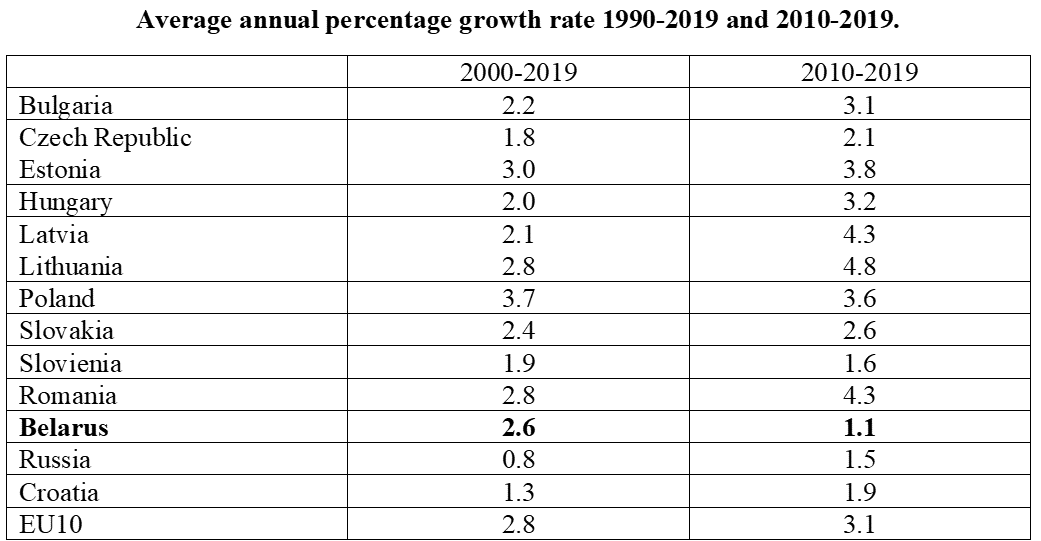
Source: World Bank Database. https://databank.worldbank.org/data/source/world-development-indicators#
The Belarusian economy grew, however, strongly between 1990 and 2010. Only, Estonia, Lithuania and Poland grew more.
When Lukashenka became president, he put a stop privatisations and other reforms of the economy. He used the Russian oil and gas subsidies, to preserve the Belarusian Soviet type economy instead of introducing market economy reforms.
Russian subsidies of oil and gas has been beneficial for Belarus in at least three ways. Firstly, Belarusian agriculture and industry could buy energy prices well below the world market prices. Access to cheap energy makes it easier to compete at prevailing prices. Secondly, Belarus refined the oil and sold to other countries at world market prices. The revenues were used by the government to cover the losses of the innefficient SOEs. Thirdly, revenues were also used for the benefit of the Belarusian people. The poverty rate in the beginning of the 1990s was around 30 percent. It is below one percent now. Belarusians also enjoy a decent healthcare and childcare thanks to the oil arbitrage and favourable oil prices.
The World Bank shows that the “oil arbitrage” resulted in oil product exports which generated revenues amounting to about one-third of total merchandise export revenues between 2000 and 2009. During the same period, implicit transfers associated with imports of oil from Russia at prices below those of the world market were estimated to be on average at 7.4 percent of GDP per year. Except for 2010, when there was a big disagreement between the two countries, the subsidies amounted to between 6 and 15 of Belarusian GDP, see here.
The subsidies explain how a refined oil can occupy such large shares of total exports in a country without oil deposits, c.f. Figure 3.
Figure 2. Exports of refined oil as shares in total Belarusian exports 1998-2018.

Source: The Atlas of Economic complexity. Harvard University Growth Lab https://atlas.cid.harvard.edu/
The reason for the halting growth in 2010 is gradual revision of the terms fixing the price of oil imports from Russia in together with declining oil prices, c.f. Figure 3.
Figure 3. The price of oil and Belarussian GDP.

Source: GDP:World Bank Database. https://databank.worldbank.org/data/source/world-development-indicators#. Oil price: FredEconomic Data. https://fred.stlouisfed.org
No wonder then that the Belarusian economy which has been propped up by Russian subsidies of gas and oil, took a dip hit after 2010 when Russia decided to stop subsidising its gas and oil exports to Belarus. The Russian tax manoeuvre, as they were announced initially would eliminate the Belarussian economy from its oil-arbitrage revenues. Whatever will happen with this is not clear. It depends on the outcome of the current crisis.
The Belarussian dependency on gas and oil subsidies, and on the Russian market for Belarussian agriculture and manufacturing products, explains the strong correlation between the two countries’ relative GDP changes, c.f. Figure 4.
Figure 4. Relative changes of Belarusian and Russian GDP.
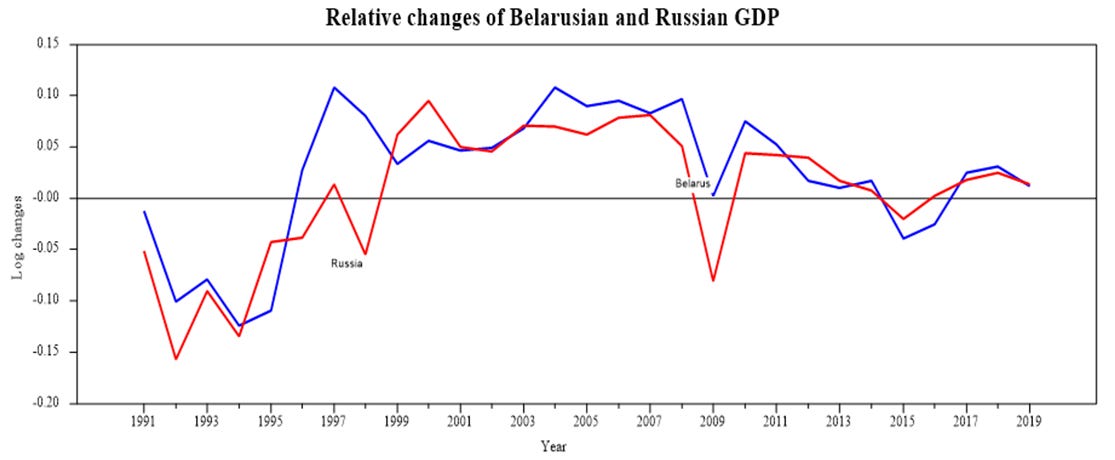
Source: World Bank Database. https://databank.worldbank.org/data/source/world-development-indicators#
Belarus is part of the mal-functioning Eurasian Economic Union. Although it is supposed to eliminate trade barriers between its members, Russia has often implemented tariffs and quotas on the other members to protect its own industries. Russian restrictions on Belarussian dairy exports have been in place since 2017.
SOEs and other firms directly or indirectly controlled by the state accounts for around half of total employment and GDP. Capital and labour are allocated according to political decisions following development plans. This practice in combination with administered prices and soft budget restriction for the SOEs have preserved an old low-technology industry structure including an oversized and inefficient agricultural sector.
Declining Russian subsidies and oil prices have revealed previously hidden inefficiencies in Belarus’s economy. Total factor productivity growth has been negative the last decade, c.f. Figure 5.
Figure 5. Contributions to Belarusian GDP growth 2009-2017 (percentage points).

Source: IMF Country report No. 19/9. https://www.imf.org/en/Publications/CR/Issues/2019/01/18/Republic-of-Belarus-2018-Article-IV-Consultation-Press-Release-Staff-Report-and-Statement-by-46526
The inefficiency of the Soviet economy casts a long shadow on the Belarus’s agricultural sector which is dominated by more than fourteen hundred large agricultural enterprises primarily owned by the state. The average agricultural enterprise employs about 230 workers. In 2016, households only “owned” around 10 percent of the agricultural land but accounted for 20 percent of the total agricultural output (and a third of total crop production).
Wage formation in Belarus is heavily regulated. Wage targets for national, regional down to town-levels, are set by the President and the government. Wage targets are formulated in development plans stretching several years. For years in between, wage targets or targets in terms of the growth of disposable incomes of the population are set.
Variations in productivity across sectors and regions are not reflected in the wage targets to any large extent. Sectoral wage developments and regional developments are therefore strongly correlated. As a result, wage growth has outpaced labour productivity growth over time, c.f. Figure 6.
Figure 6. Wages and productivity in Belarus.

Source: IMF (2014) https://www.imf.org/external/pubs/ft/scr/2014/cr14227.pdf
As shown by IMF, Lukashenka tend to use upcoming elections as reasons for wage increases.
The inefficiency of the SOEs also show up in the excess employment. Even of the SOE share of employment has declined the last decade, there is still a significant proportion of SOE employed which would be significantly more productive in other parts of the economy. This commanded labour hoarding is the cause of the low unemployment in Belarus. Another large contributing factor is the fact that unemployment is penalised by the “Law against Social Parasites” which Lukashenka introduced by decree in 2015. People who were employed less than 183 days in an employment year the equivalent of 184 US dollars.
The wage setting system takes employees’ educational levels, the complexity of the job and other factors such as absence of complaints into account. For the specifics of wage setting, see here.
Wage developments are closely related to pensions and household income. The meagre economic developments the last decade have also made households more vulnerable. In 2015, the poverty headcount at PPP US$10/day increased by 2 percentage points on the national level. In some regions, the increases were much larger. There is a large share of population just above the US$10/day threshold. For these people, poor or negative economic growth can have severe consequences.
The Russian subsidies and the favourable oil price allowed Lukashenka and his government to implement policies that reduced the poverty rate significantly. Unfortunately, his unwillingness to reform the economy has put a large share of the population at risk.
Lukashenka is credited for ending the corruption and asset stripping by former communist politicians and bureaucrats that plagued the country after the collapse of the Soviet Union. The experiences of other former Soviet republics such as Russia and Ukraine were avoided. But merely to repeat those mistakes made in the East, is not a recipe for success. In Poland on Belarus’s eastern border, asset stripping and pervasive corruption was also avoided. But in contrast to Belarus and Russia, reforms aiming at improving Rule and law as well as the economy were consistently undertaken. See here for an analysis and comparison of Poland’s and Ukraine's economic developments.
The purpose of the reforms in Poland was to pass the conditions for membership as requested by the Acquis Communitaire. The access to the Single Market was beneficial for the Polish economy which did not stop growing until the Corona crisis broke out, c.f. Figure 7.
Figure 7. GDP per capita developments in Belarus, Poland and Russia since 1990.

Source: World Bank Database. https://databank.worldbank.org/data/source/world-development-indicators# Note: The series are shown as logs of an index, which equals 1.0 at 1990 so the series start at zero. Since the vertical axis is in log units, the slopes of the series are the rates of growth. An increase of 0.1 is a growth of 100*(exp(0.1)-1).
For people in former communist countries, membership in the EU also meant freedom, democracy, free and fair elections and guaranteed civil rights as shown here. But freedom, civil rights and free and fair elections is of course unacceptable to Lukashenka. That’s why he has clamped down on the opposition ever since he became president.
Read more:
IMF (2014). Country Report No. 14/227. REPUBLIC OF BELARUS. SELECTED ISSUES. https://www.imf.org/external/pubs/ft/scr/2014/cr14227.pdf
IMF (2019). Country Report No. 19/9, Republic of Belarus. Article IV Consultation. https://www.imf.org/en/Publications/CR/Issues/2019/01/18/Republic-of-Belarus-2018-Article-IV-Consultation-Press-Release-Staff-Report-and-Statement-by-46526
World Bank (2017). “Fiscal Incidence in Belarus : A Commitment to Equity Analysis.” Policy Research Working Paper 8216.
World Bank (2018) Systematic Country Diagnostic: Towards a Competitive, Inclusive and Dynamic Belarus http://documents1.worldbank.org/curated/en/602921520877070059/pdf/Belarus-SCD-03072018.pdf